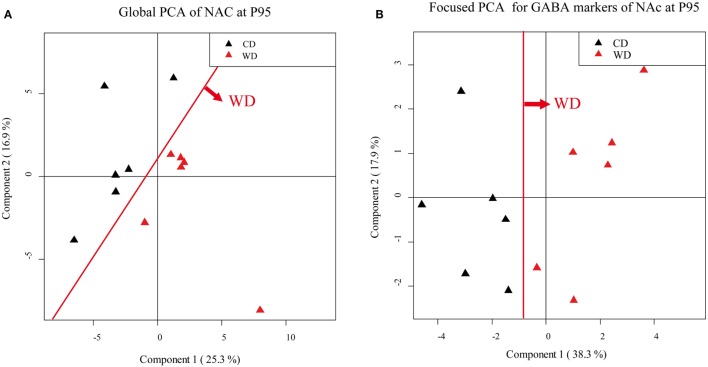
Figure 5.
Principal component analysis (PCA). Score scatter plot of PCA (A,B). (A) Global PCA from nucleus accumbens (NAc) samples of P95 rat males. Black triangles correspond to offspring from control diet (CD) fed dams and red triangles correspond to offspring from western diet (WD) fed dams. (B) Focused PCA for γ-aminobutyric acid (GABA) markers, from NAc samples of P95 rat males. Black triangles correspond to offspring from CD fed dams, and red triangles correspond to offspring from WD fed dams. The red line shows the clear separation between the groups.

