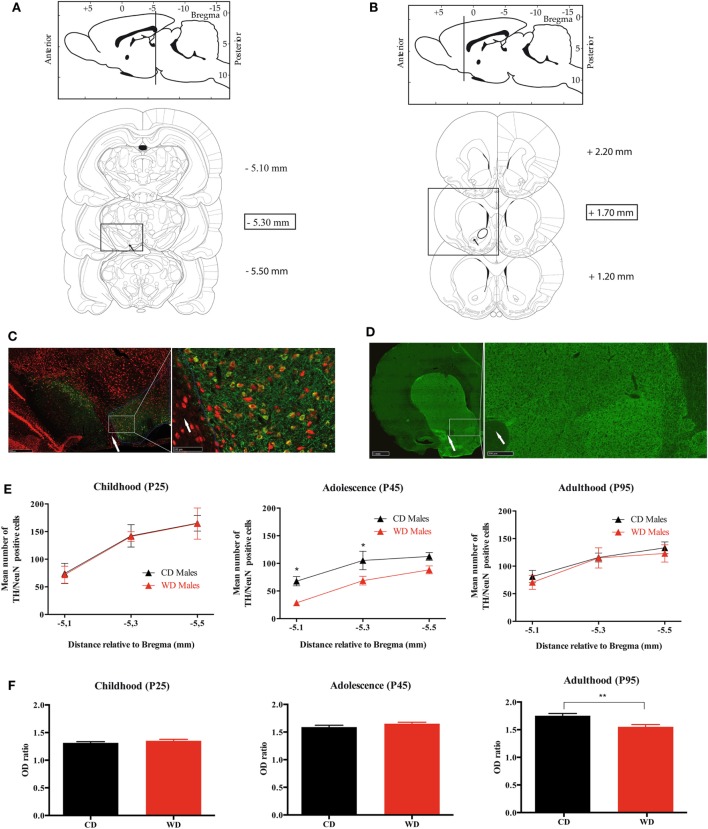
Figure 6.
Quantification of TH/NeuN positive neurons in ventral tegmental area (VTA) and TH density fibers in nucleus accumbens (NAc) from weaning to adulthood in offspring from western diet (WD) or control diet (CD) fed dams. (A) Scheme from Paxinos and Watson’s atlas. Upper panel: sagittal view of the antero-posterior level of the VTA. Lower panels: the three rostrocaudal levels quantified for TH (+)/NeuN(+) immunostaining. The black arrow shows the exit of the third nerve that is used as anatomical landmark. The scale on the right corresponds to the rostrocaudal section localizations in millimeters from Bregma. (B) Scheme from Paxinos and Watson’s atlas. Upper panel: sagittal view of the antero-posterior level of the NAc. Lower panels: the three rostrocaudal levels quantified for TH fibers density immunostaining. The scale on the right corresponds to the rostrocaudal section localizations in millimeters from Bregma. (C) Photomicrograph of TH/NeuN immunostaining at the level of the VTA, −5.30 mm from Bregma. Red labeling is for NeuN, and green one for TH. The white arrow shows the exit of the third nerve. The white circle delimitates the VTA localization. (D) Photomicrograph of TH immunostaining at the level of the NAc, +1.70 mm from Bregma. Green labeling is for TH. The white arrow shows the anterior commissure. (E) Three graphs (childhood, adolescence, and adulthood) of TH/NeuN quantification at three rostrocaudal levels of the VTA. Black triangles indicate the mean counts from the VTA of the CD dams offspring and the red triangles indicate the mean counts from the VTA of the WD dams offspring. *Significant difference at p < 0.05. (F) Three graphs (childhood, adolescence, and adulthood) of TH fibers density at three rostrocaudal levels of the NAc. Black plots indicate the mean optical density (OD) ratio of the CD dams’ offspring, and the red plots indicate the mean OD ratio of the NAc WD dams’ offspring. **Significant difference at p < 0.01.

