
Fig. 4.
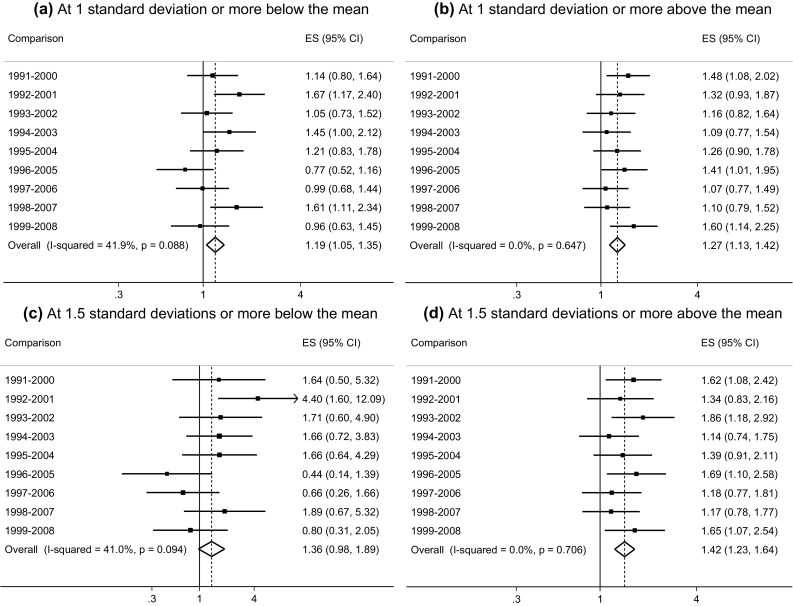
Meta-analysis of odds ratios comparing the proportion of young women at 1 standard deviation and 1.5 standard deviations or move above and below the pooled GHQ-12 mean score across 9-year intervals (BHPS: 1991–2008)
Official websites use .gov
A
.gov website belongs to an official
government organization in the United States.
Secure .gov websites use HTTPS
A lock (
) or https:// means you've safely
connected to the .gov website. Share sensitive
information only on official, secure websites.
Meta-analysis of odds ratios comparing the proportion of young women at 1 standard deviation and 1.5 standard deviations or move above and below the pooled GHQ-12 mean score across 9-year intervals (BHPS: 1991–2008)