FIGURE 4.

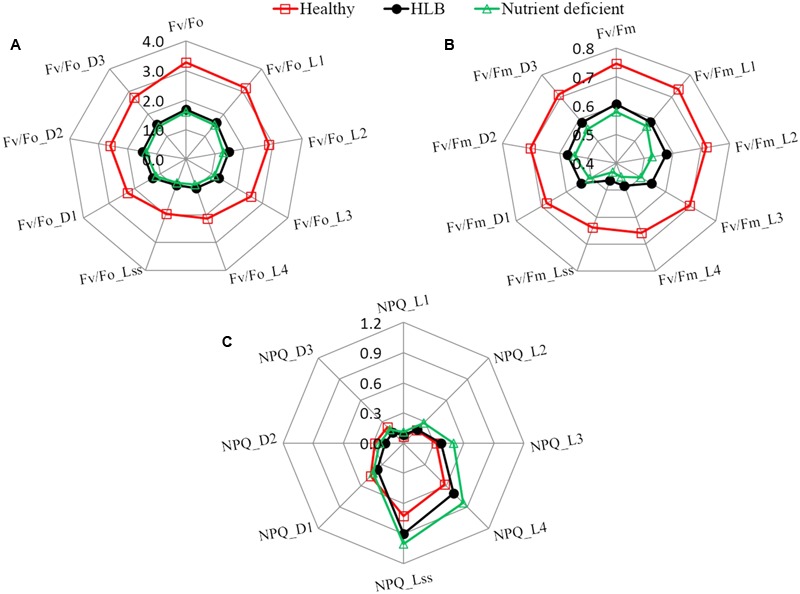
Spider plots of selected fluorescence parameters including (A) Fv/Fo, (B) Fv/Fm, and (C) NPQ at different states of healthy, HLB infected and nutrient deficient citrus leaves measured during fluorescence quenching process.

Spider plots of selected fluorescence parameters including (A) Fv/Fo, (B) Fv/Fm, and (C) NPQ at different states of healthy, HLB infected and nutrient deficient citrus leaves measured during fluorescence quenching process.