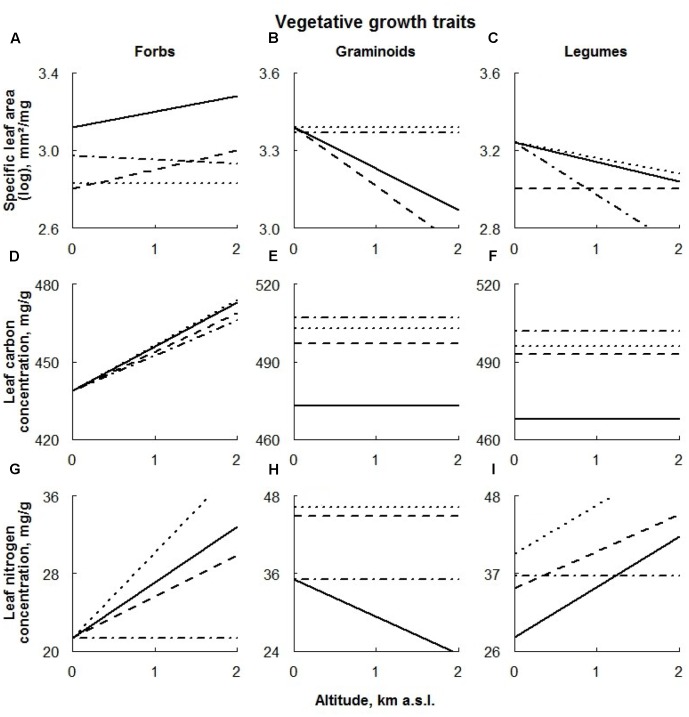
FIGURE 4.
Visual description of the linear models showing the effects of ECE on vegetative growth traits of the different plant functional types [‘Forbs’ (A,D,G), ‘Graminoids’ (B,E,H), and ‘Legumes’ (C,F,I); Table 2]. Solid line: control; dashed line: AD treatment; dotted line: DE treatment; dot-dashed line: DR treatment (for details see Materials and Methods section).

