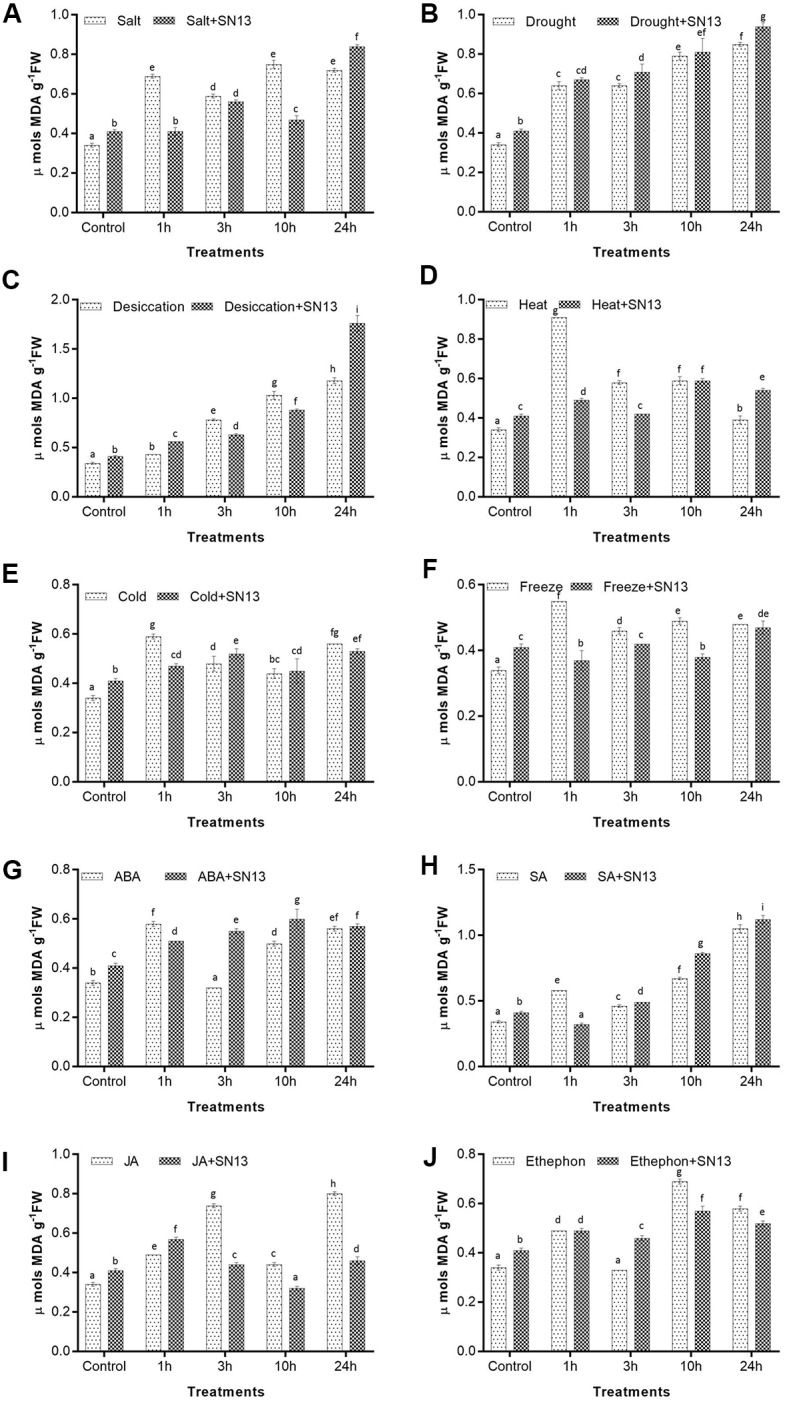
FIGURE 3.

Determination of MDA content in rice exposed to salt (A), drought (B), desiccation (C), heat (D), cold (E), freeze (F), ABA (G), SA (H), JA (I), and ethephon (J) stress at 1, 3, 10, and 24 h in the presence or absence of SN13. Data represent the means ± SD of four independent experiments. Different letters on the graph indicate significant differences according to Duncan’s test (P ≤ 0.05).
