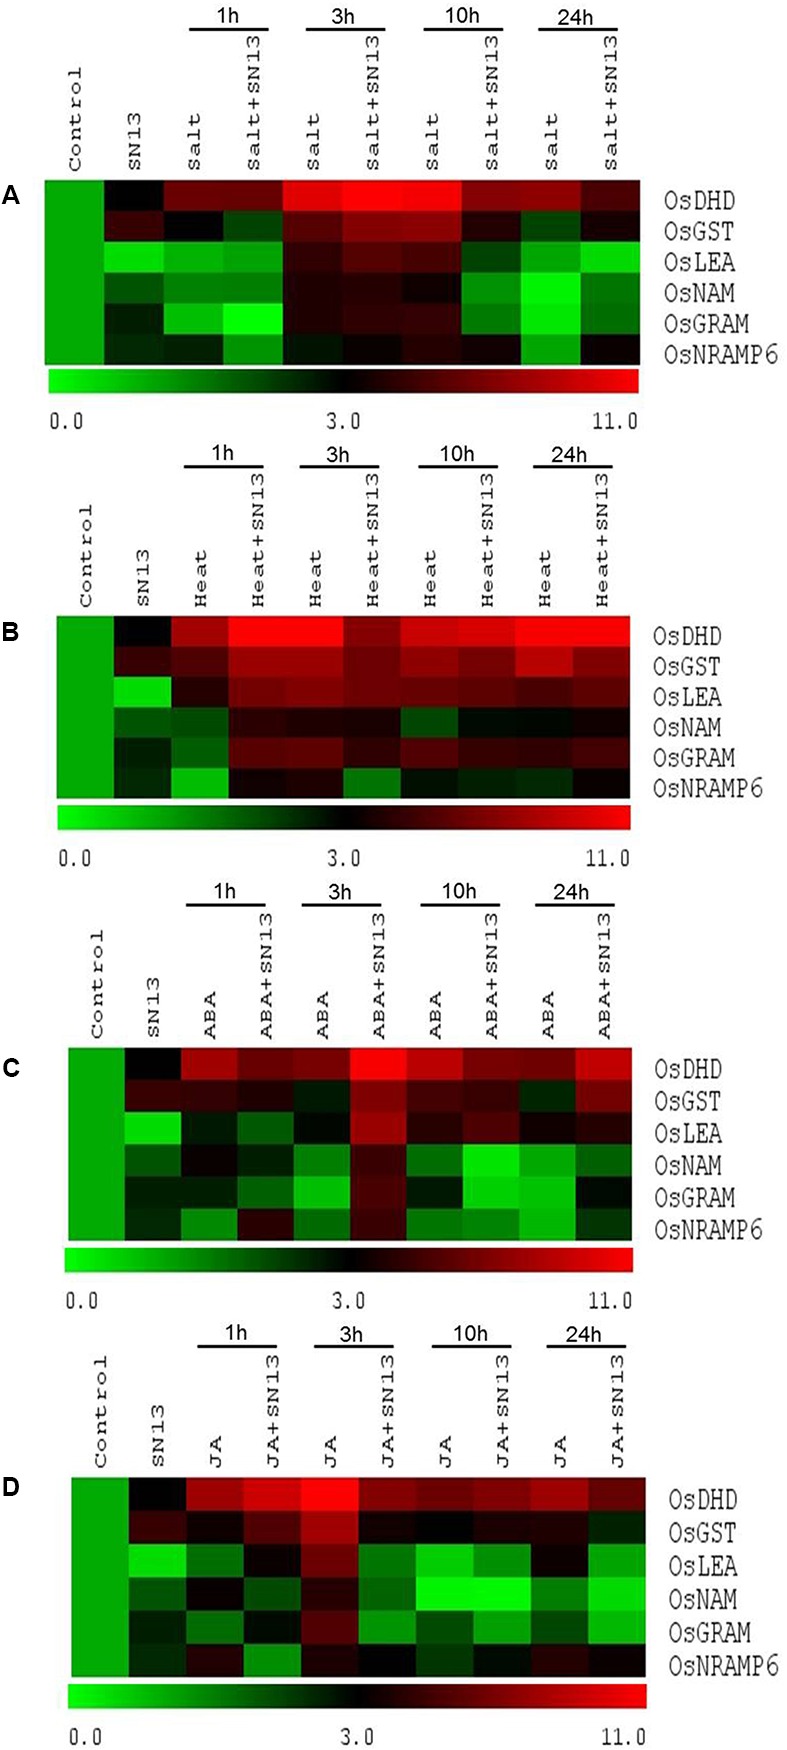
FIGURE 4.

Differential expression of genes in rice exposed to salt (A), heat (B), ABA (C), and JA (D) stress at 1, 3, 10, and 24 h in the presence or absence of SN13. The heat map has been generated based on the fold-change values in the treated sample when compared with its unstressed control sample. The color scale for fold-change values is shown at the bottom.
