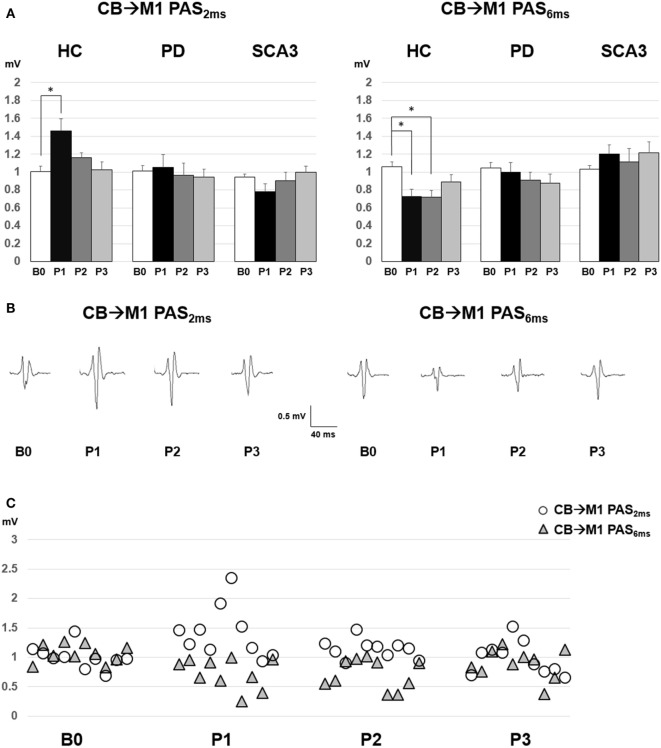
Figure 1.
(A) Motor-evoked potential (MEP) amplitudes (mean ± SEM in mV) recorded from the right first dorsal interosseus muscle in the healthy control (HC), Parkinson’s disease (PD), and spinocerebellar ataxia 3 (SCA3) groups. Comparisons between pre- (B0), immediate (P1), 30 min (P2), and 60 min (P3) post-CB → M1 PAS2ms vs. CB → M1 PAS6ms were shown. A significant MEP facilitation at P1 after CB → M1 PAS2ms and MEP suppression at P1 and P2 after CB → M1 PAS6ms were noted for the HC group (*P < 0.05 by non-parametric Mann–Whitney U test with Bonferroni’s correction). (B) The averaged MEP waveforms for the 10 subjects in the HC group. (C) Individual MEP data of the HC group (n = 10).

