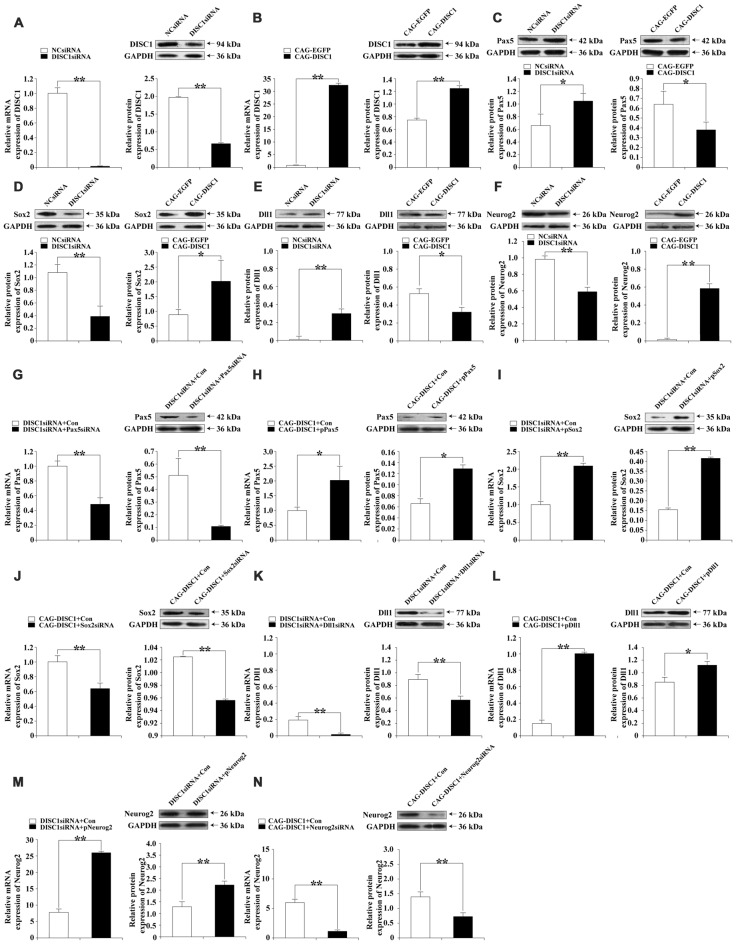
Figure 2.
mRNA and protein expression levels of DISC1, Paired box gene 5 (Pax5), sex determining region Y-box 2 (Sox2), delta-like1 (Dll1) and Neurogenin2 (Neurog2) in knockdown and exogenous expression experiments. Real-time polymerase chain reaction (RT-PCR) and Western blotting were performed on cells where gene expression was modulated with siRNA, plasmid, or retroviral vector. RT-PCR and Western blots are paired according to the molecule analyzed for each gene interference experiment, except in (C–F) where only Western blots are shown. Bar graphs are used to display quantification by RT-PCR and Western blotting. The relative intensities of DISC1, Pax5, Sox2, Dll1 and Neurog2 by Western blot were normalized to the internal reference protein glyceraldehyde-3-phosphate dehydrogenase (GAPDH; KangChen Bio-tech, Shanghai, China). (A) DISC1, DISC1siRNA; (B) DISC1, CAG-DISC1; (C) Pax5, DISC1siRNA (Left); Pax5, CAG-DISC1 (Right); (D) Sox2, DISC1siRNA (Left); Sox2, CAG-DISC1 (Right); (E) Dll1, DISC1siRNA (Left); Dll1, CAG-DISC1 (Right); (F) Neurog2, DISC1siRNA (Left); Neurog2, CAG-DISC1 (Right); (G) Pax5, DISC1siRNA + Pax5siRNA; (H) Pax5, CAG-DISC1 + pPax5; (I) Sox2, DISC1siRNA + pSox2; (J) Sox2, CAG-DISC1 + Sox2siRNA; (K) Dll1, DISC1siRNA + Dll1siRNA; (L) Dll1, CAG-DISC1 + pDll1; (M) Neurog2, DISC1siRNA + pNeurog2; (N) Neurog2, CAG-DISC1 + Neurog2siRNA *p < 0.05; **p < 0.01 (controls-NCsiRNA, CAG-EGFP, DISC1siRNA + Con, CAG-DISC1 + Con). All results are from three independent experiments.

