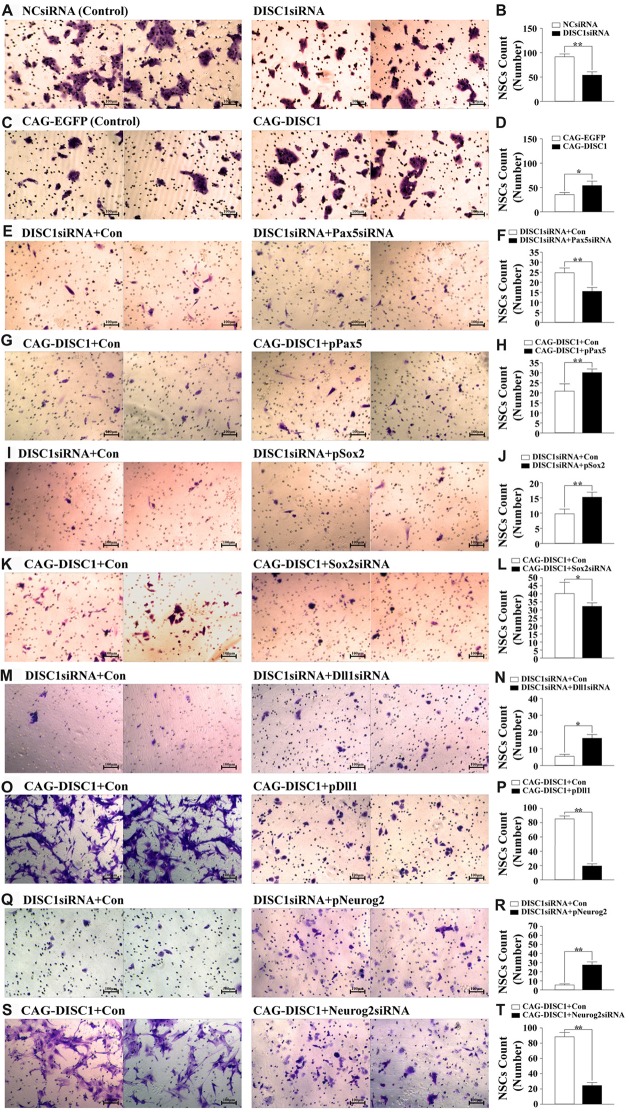
Figure 4.
DISC1 promotes the migration of MNSPCs. Migration of control or altered MNSPCs was examined in transwell assays, and migrated cells were stained with crystal violet. Migrated cell counts are represented as bar graphs. Gene interference molecule (siRNA or expression construct) are as indicated. (A) Crystal violet stain, negative control siRNA (NCsiRNA) (control); DISC1siRNA; (B) bar graph, NCsiRNA (control) vs. DISC1siRNA; (C) crystal violet, CAG-EGFP (control); CAG-DISC1; (D) bar graph, CAG-EGFP (control) vs. CAG-DISC1; (E) crystal violet, DISC1siRNA (control); DISC1siRNA + Pax5siRNA; (F) bar graph, DISC1siRNA (control) vs. DISC1siRNA + Pax5siRNA; (G) crystal violet, CAG-DISC1 (control); CAG-DISC1 + pPax5; (H) bar graph, CAG-DISC1 (control) vs. CAG-DISC1 + pPax5; (I) crystal violet, DISC1siRNA (control); DISC1siRNA + pSox2; (J) bar graph, DISC1siRNA (control) vs. DISC1siRNA + pSox2; (K) crystal violet, CAG-DISC1 (control); CAG-DISC1 + Sox2siRNA; (L) bar graph, CAG-DISC1 (control) vs. CAG-DISC1 + Sox2siRNA; (M) crystal violet, DISC1siRNA (control); DISC1siRNA + Dll1siRNA; (N) bar graph, DISC1siRNA (control) vs. DISC1siRNA + Dll1siRNA; (O) crystal violet, CAG-DISC1 (control); CAG-DISC1 + pDll1; (P) bar graph, CAG-DISC1 (control) vs. CAG-DISC1 + pDll1; (Q) crystal violet, DISC1siRNA (control); DISC1siRNA + pNeurog2; (R) bar graph, DISC1siRNA (control) vs. DISC1siRNA + pNeurog2; (S) crystal violet, CAG-DISC1 (control); CAG-DISC1 + Neurog2siRNA; (T) bar graph, CAG-DISC1 (control) vs. CAG-DISC1 + Neurog2siRNA. *p < 0.05, **p < 0.01 (controls-NCsiRNA, CAG-EGFP, DISC1siRNA + Con, CAG-DISC1 + Con). All results are from three independent experiments.

