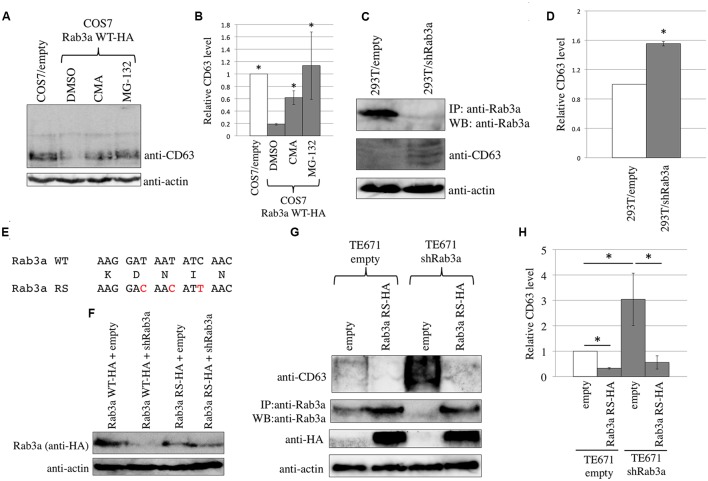
FIGURE 3.
Endogenous Rab3a induced the degradation of endogenous CD63. (A) COS7 cells transduced using the empty or Rab3a WT-HA-encoding MLV vector were treated with DMSO, CMA, or MG-132. Cell lysates were analyzed by western blotting using anti-CD63 and anti-actin antibodies. (B) Endogenous CD63 levels were normalized against the actin levels. The normalized CD63 levels in the DMSO-treated, Rab3a WT-HA-expressing cells were set to 1 and the relative values ± SD are indicated. Asterisks indicate significant differences compared with the values in the DMSO-treated, Rab3a WT-HA-expressing cells. (C) 293T cells were transduced using the shRab3a-encoding lentivirus vector. Their cell lysates were immunoprecipitated with anti-Rab3a antibody. The precipitates were analyzed by western blotting using anti-Rab3a antibody. Cell lysates were also analyzed by western blotting using anti-CD63 and anti-actin antibodies. (D) The endogenous CD63 levels were normalized against the actin levels. The normalized CD63 levels in the empty vector-transduced cells were set to 1 and the relative values ± SD are indicated. Asterisk shows statistically significant differences to the values in the empty vector-transduced cells. (E) Nucleotide (upper and lower lines) and amino acid (middle line) sequences of the shRab3a target in Rab3a WT and Rab3a RS are indicated. Red characters indicate nucleotide substitutions in the Rab3a RS. (F) 293T cells were transfected using Rab3a WT-HA or Rab3a RS-HA (100 ng) together with empty or shRab3a-expressing plasmid (1 μg). Cell lysates from the transfected cells were analyzed by western blotting with anti-HA and anti-actin antibodies. (G) TE671/empty or TE671/shRab3a cells were inoculated with the Rab3a-RS-HA-encoding MLV vector. Cell lysates were analyzed by western blotting with anti-CD63, anti-HA, and anti-actin antibodies. Precipitates by anti-Rab3a antibody were analyzed by western blotting with the same antibody. (H) The endogenous CD63 levels were normalized against the actin levels. The normalized CD63 levels in the empty vector-transduced cells were set to 1 and the relative values ± SD are indicated. Asterisks show statistically significant differences between the two groups.

