
FIGURE 5.
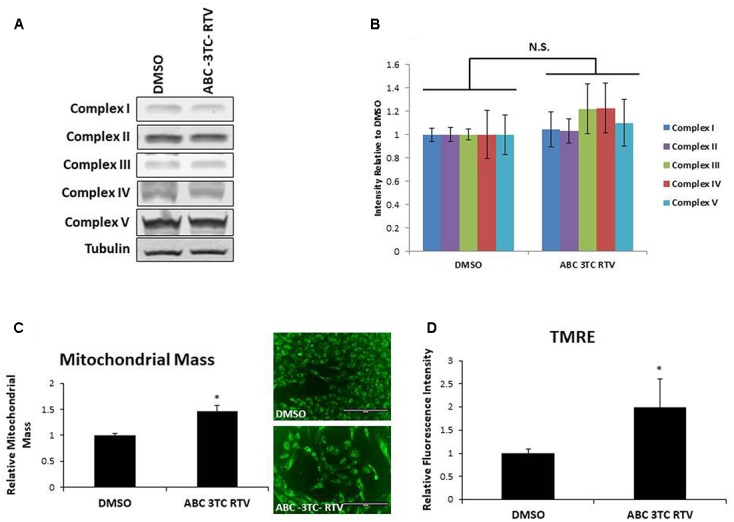
Effect of HAART drugs on mitochondrial mass and mitochondrial membrane potential. Human astrocytes were treated with ABC 10 μM, 3TC 5 μM, and RTV 1 μM for 1 week before assaying. (A) Representative Western blot showing protein levels of the mitochondrial electron transport chain complexes. (B) Quantification of A. (C) Mitochondrial mass, cells were incubated with mitotracker for 30 min prior to quantification by flow cytometry as displayed on the left. Right is representative microscopy of fluorescence at 20× before undergoing flow cytometry. (D) TMRE, cells were incubated with TMRE for 30 min prior to quantification by flow cytometry. ∗p-value < 0.05, n = 3, error bars are SD.