FIGURE 1.

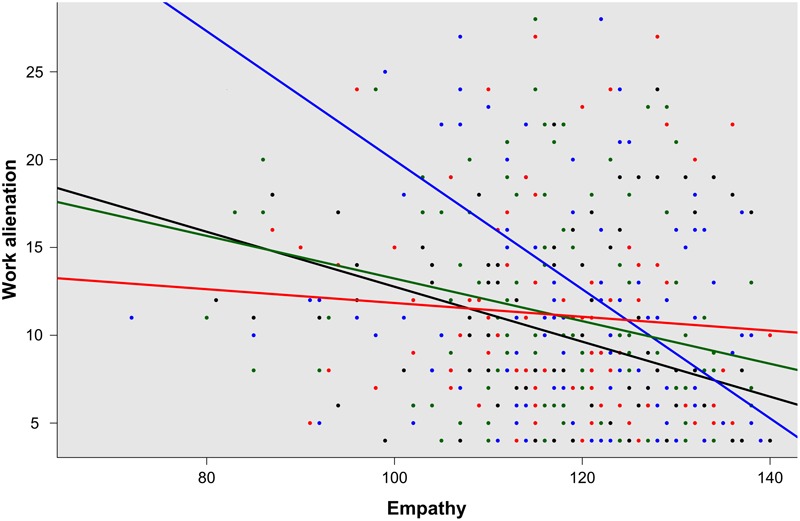
Regression analysis for “occupation by sex” groups, male physicians (black), women physicians (green), male nurses (blue), and women nurses (red), according to alienation by empathy (p = 0.03).

Regression analysis for “occupation by sex” groups, male physicians (black), women physicians (green), male nurses (blue), and women nurses (red), according to alienation by empathy (p = 0.03).