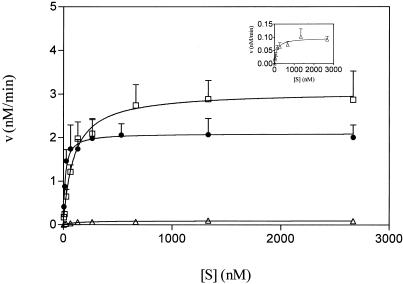
Figure 3.
Steady-state kinetic analysis of M.SinI methylation using three different DNA substrates. Circles, GGA/TCC; squares, GGI/CCC; triangles, GGG/CCC. (Inset) Plot of GGG/CCC data using a smaller velocity scale. The curves were generated from three experiments as described in Materials and Methods. For clarity, standard error of the mean bars are shown only above the data points.

