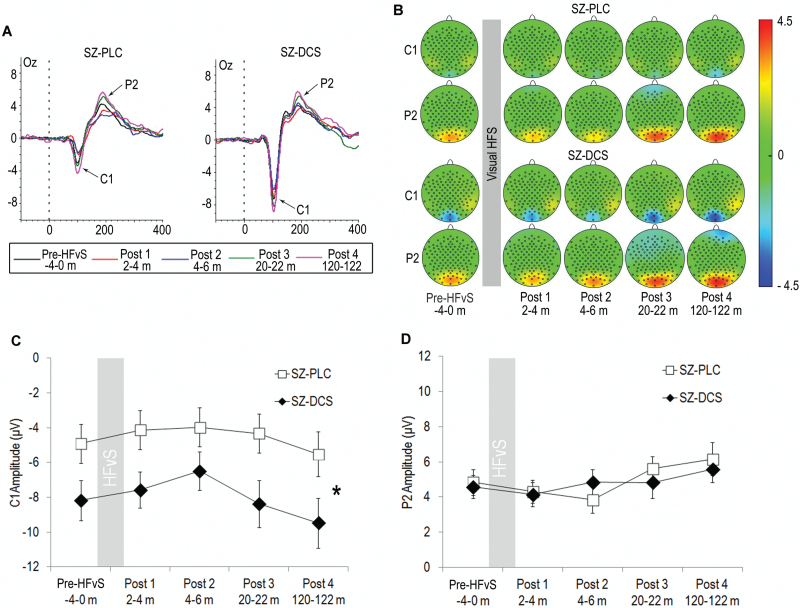
Fig. 3.
(A) Average visual evoked potentials (VEPs) elicited by the checkerboard stimulus in Oz and (B) topography of VEPs for schizophrenia patients who received placebo (SZ-PLC) or DCS (SZ-DCS) across assessment blocks. The VEP included a negative component, C1, and a positive component, P2. (C) Mean (±SE) C1 amplitude was larger across blocks in SZ-DCS compared to SZ-PLC*. (D) Mean (±SE) P2 amplitude was similar in SZ-PLC and SZ-DCS across blocks.

