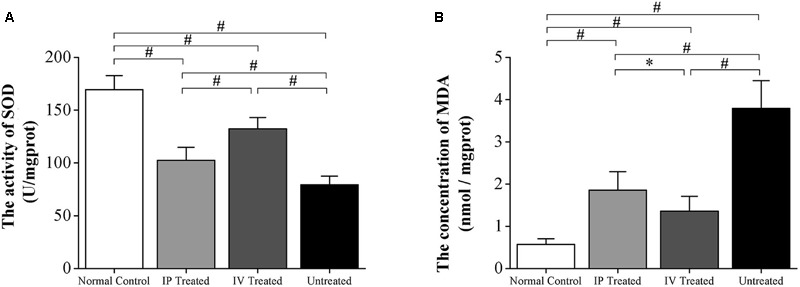
FIGURE 4.

Hydrogen rich saline induced effects on the oxygen stress markers of MNU administered rats. (A) The SOD level of the untreated group was significantly lower than the IV and IP treated group (P < 0.01). Particularly, the SOD level of IV treated group was substantially higher than the IV and IP treated group (P < 0.01). (B) The MDA level of the untreated group increased drastically than the normal controls (P < 0.01). The MDA level of both IV and IP treated groups also increased significantly than the normal controls (P < 0.01). However, both of them were significantly lower than the untreated group (P < 0.01). The MDA level of the IV treated group was significantly lower than the IP treated group (P < 0.01). (All the values were presented as mean ± SD; ∗P < 0.05, #P < 0.01 for differences compared between the animal groups).
