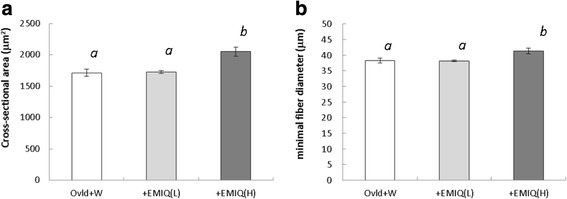
Fig. 3.

Cross-sectional area (a) and minimal fiber diameter (b) of the plantaris muscle in Study 2. Values are mean ± SEM. Means without a common letter are statistically different (P < 0.05, one-way ANOVA (analysis of variance) followed by Tukey’s test). Ovld + W: functionally overloaded mice receiving whey protein, +EMIQ (L): functionally overloaded mice receiving whey protein and EMIQ at a low concentration, +EMIQ (H): functionally overloaded mice receiving whey protein and EMIQ at a high concentration
