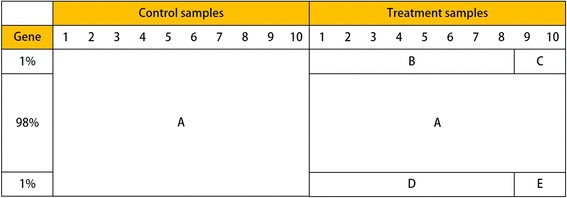
Fig. 4.

An example of simulated data structure. Each row and each column of this data frame correspond to a gene and a replicate sample, respectively, so we have a 10,000 × 20 data matrix in this study. We assume that there are 2% target genes (1% up-regulated and 1% down-regulated genes) among the total of 10,000 genes, and ten replicates in each group. There are five different distributions of data points: A, B, C, D, and E; groups C and E indicate outlier samples
