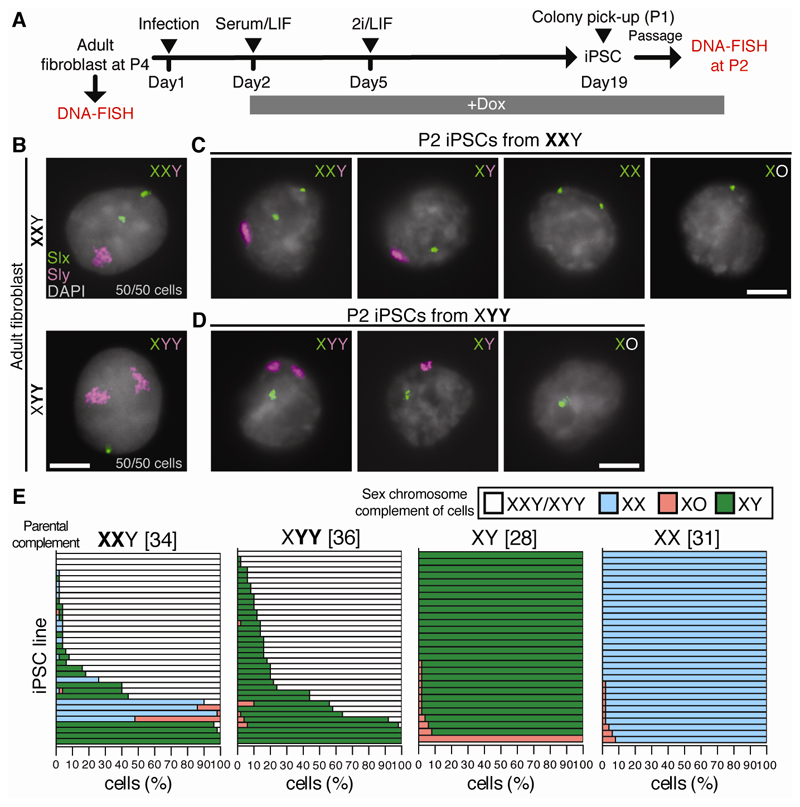
Fig. 1. Chromosome loss through iPSC reprogramming of SCT fibroblasts.
(A) Experimental scheme to generate XXY, XYY, XY and XX iPSCs. 2i: inhibitors of GSK3ß and Mek1/2. LIF: leukemia inhibitory factor. (B-D) Slx (green) and Sly (magenta) DNA-FISH of (B) fibroblasts and (C, D) P2 iPSCs from XXY and XYY mice (n = 50 cells). Scale bars: 5 µm. (E) P2 iPSC sex chromosome complements. Each bar represents an iPSC line and the percentage of cells exhibiting each complement (n = 50 cells per line). Numbers in brackets show number of iPSC lines examined. Data for two animals combined.

