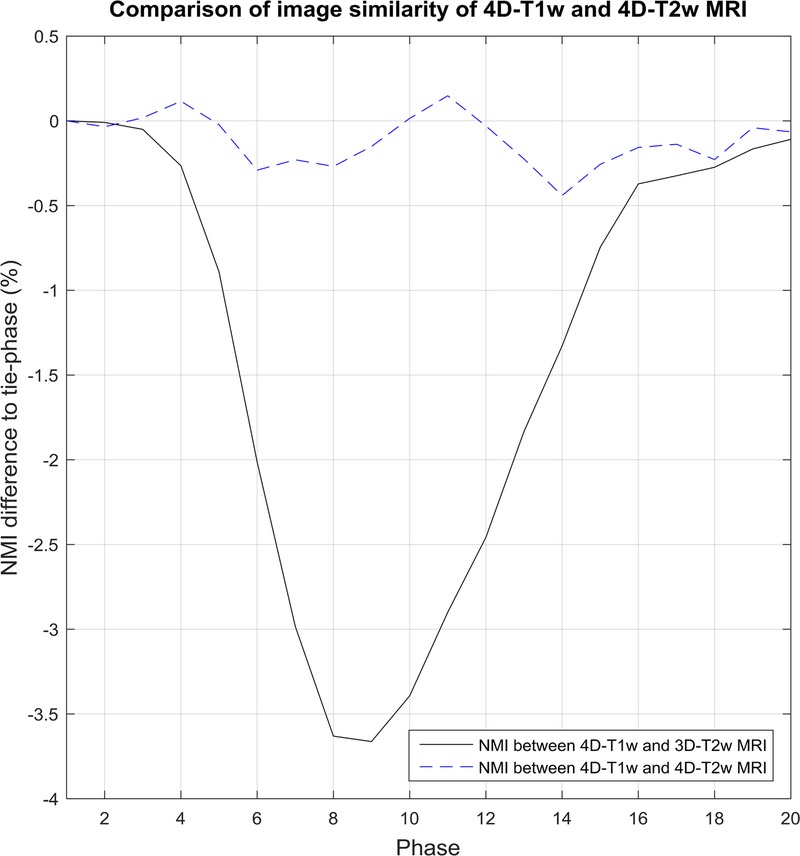
FIGURE 7.

Shows an example comparison for patient 10, where results are relative to the normalized mutual information (NMI) calculated between the tie-phase of 4D-T1w and 3D-T2w MRI. In this case, the tie-phase is respiratory phase 1. NMI between 4D-T1w and 3D-T2w MRI (black solid line) indirectly corresponds to a respiratory signal. This pattern is not observed when examining NMI between 4D-T1w and 4D-T2w MRI (blue dashed curve).
