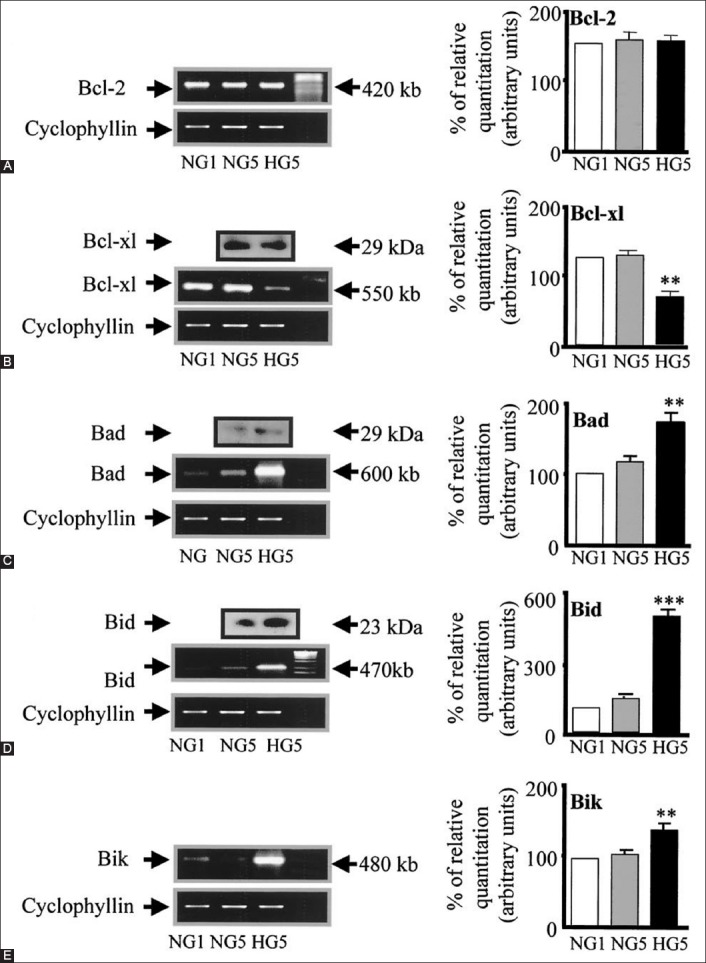
FIGURE 5.

Bcl family gene regulation in human islets cultured in high versus normal glucose. Expression of Bcl-2, Bcl-xl, Bad, Bid and Bik mRNA was detected by reverse transcription polymerase chain reaction and quantified by FluorImager analysis of ethidium bromide signal. In each experiment, band densities were normalized against cyclophyllin, and the result are expressed as mRNA level to NG1 control islets (NG1 = 100%). (A) Bcl-2, (B) Bcl-xl (HG5 versus [vs.] NG5, **p<0.01), (C) Bad (HG5 vs. NG5, **p<0.01), (D) Bid (HG5 vs. NG5, ***p<0.001), (E) Bik (HG5 vs. NG5, **p<0.01). From reference 22 - Federici M, Hrivbal M, Perego L, Ranalli M, Caradonna Z, Perego C, et al. Diabetes 2001;50(6):1290-1301. © 2001 by the American Diabetes Association Diabetes 2001 Jun; 50(6):1290-1301 Reprinted with permission from the American Diabetes Association.
