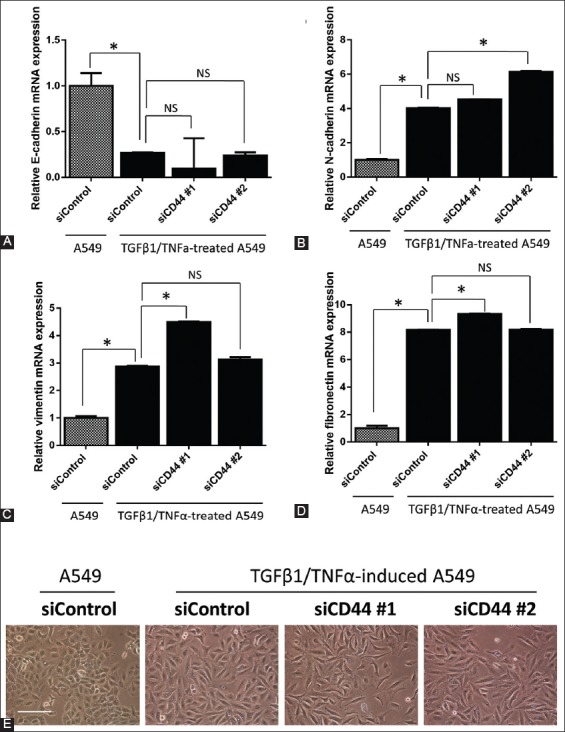
FIGURE 3.

The mRNA expression of (A) E-cadherin, (B) N-cadherin, (C) vimentin, and (D) fibronectin in CD44 knockdown A549 cells, after TGFβ1/TNFα treatment. Data were normalized to actin expression. (E) A549 cells (1.5 × 10⁵) in 6-well plates were reverse transfected with control siRNA oligo (siControl) and two siRNA oligos against CD44 (siCD44 #1 and #2) and allowed to adhere for 24 hours. The cells were then treated with TGFβ1/TNFα for 24 hours. Representative images of A549 cells were photographed. The bar represents 200 μM. The results are expressed as mean ± standard deviation. *p<0.05 indicates a significant difference, while NS indicates a non-significant difference.
