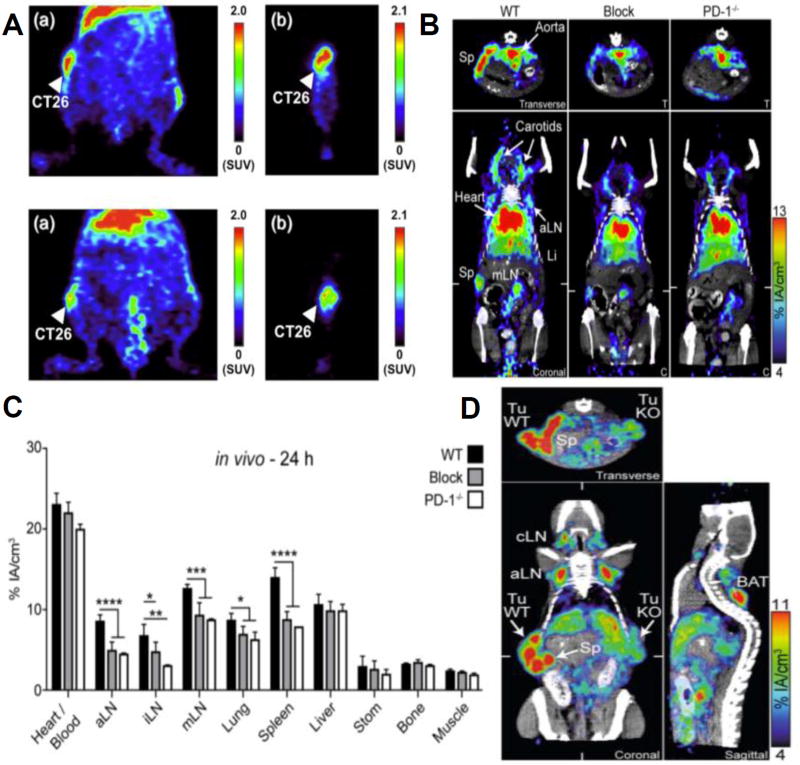
Figure 2.
Checkpoint expression and checkpoint blockade mAb biodistribution in naïve and tumor bearing mice. (A) PET images of BALB/c mice implanted with CT26 tumors 48 hours post administration of radiolabeled anti-CTLA-4 mAb (top row) or radiolabeled control IgG (bottom row). Coronal view (a) and sagittal view (b) are shown. (B) ImmunoPET/CT sections using radiolabeled anti-PD-1 mAb 24 hours post injection in naïve wildtype mice (C57BL/6) (WT), PD-1 blocked (Blocked) and PD deficient mice (PD-1−/−). White ticks in the coronal sections indicate the position of the Transverse section. (C) Quantification of B in various organs. * indicates significance relative to the Block and/or PD-1−/− groups using one-way ANOVA with Tukey’s multiple comparison test. P-values < 0.05 considered significant. (D) 10 days following implantation of C57BL/6 mice with wildtype CD133-expressing B16F10 melanoma cells on the left and CD133-expressing, PD-L1 knockout B16F10 melanoma cells on the right, radiolabeled anti-PD-L1 mAb was administered. ImmunoPET/CT images 24 hours post injection are shown here (coronal, transverse, and sagittal). (D) Reproduced from REF 46 (A) and REF 51 (B–D) with permission.

