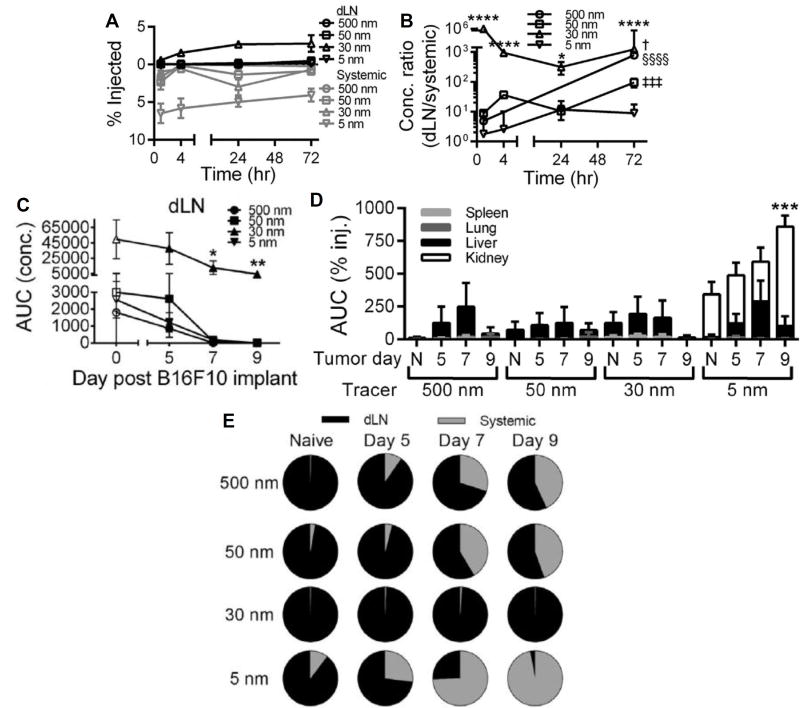
Figure 4.
Size-based principles of lymph node drug targeting are conserved in tumors. Time-resolved accumulation of tracers in draining lymph nodes (dLN) (A) and ratio of accumulating tracer concentrations within dLN to systemic tissues (B). * indicates significance relative to all other tracers at the same time point by two-way ANOVA and post-hoc Tukey’s tests. § indicates significance for 500 nm tracer relative to all other time points, ‡ for 50 nm tracer relative to all other time points, † for 30 nm tracer vs all other time points by one-way ANOVA and post-hoc Fisher’s LSD tests. One, two, three, and four symbols denoting statistical significance represent p < 0.05, 0.01, 0.001, and 0.0001, respectively. Tumor growth reduces tracer exposure within dLN (C) and increases systemic tracer accumulation in the spleen, lungs, and liver, and kidneys (D). C, *p<0.05 and **p<0.01 relative to all other tracers within same tumor day group by one-way ANOVA with post-hoc Fisher’s LSD test. D, *** indicates significance for 5 nm tracer at day 9 in kidney vs all other groups by two-way ANOVA and post-hoc Tukey’s tests. (E) Despite these distribution and transport changes resulting from tumor growth, the relative enrichment of 30 nm but not 5, 50, or 500 nm exposure within dLN relative to systemic tissues (AUC calculated from measured levels of concentrations of injected tracers in individual tissues 1–72 h p.i) seen in naïve skin is conserved. Reproduced from REF 55 with permission.

