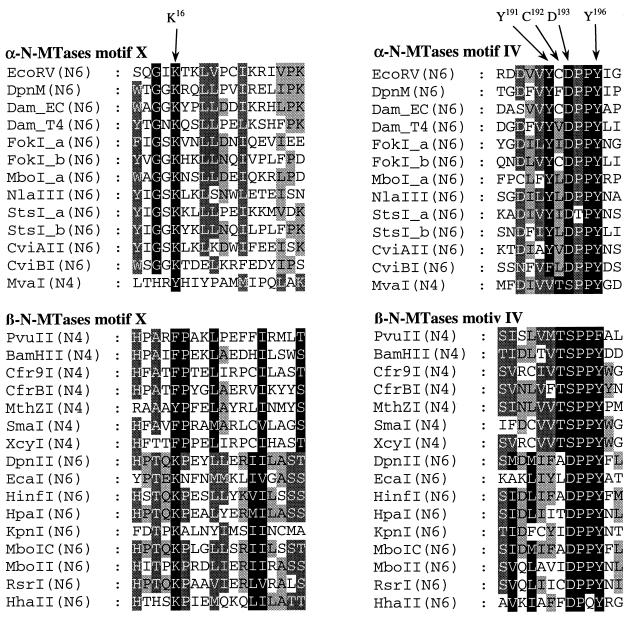
Figure 1.
Alignments of conserved regions of adenine and cytosine-specific DNA MTases belonging to the α- and β-group of MTases (11,13,15,27). The amino acid residues of M.EcoRV that were subjected to mutagenesis in this study are marked with arrows. Shading is according to the Blosum 62 scoring matrix, with black shading for 100%, dark grey for 80% and light grey for 60% conserved amino acid residues.

