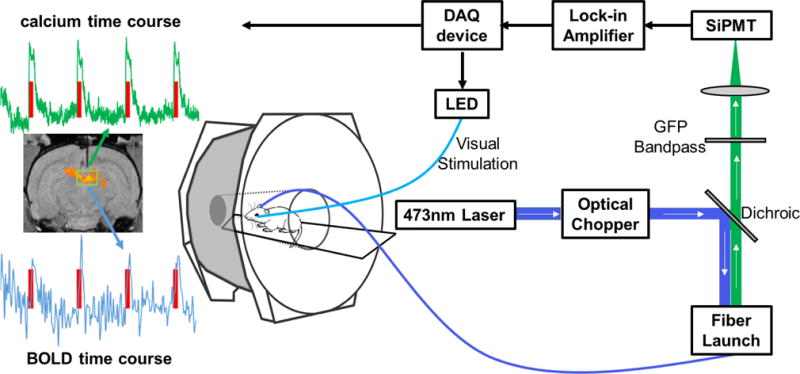
Figure 1.

Schematic illustration of the setup of simultaneous calcium-based fiber photometry and fMRI. Center: Anesthetized rodent in bore of MRI tethered to optic patch cable. Right: Fiber photometry set-up. GCaMP is excited by a 473 nm laser chopped with an optical chopper reflected off a dichroic mirror (blue line). This signal is coupled into an optical patch cable using a microscope objective and a fiber launch. The emitted fluorescent GCaMP signal is then collected through the same optical apparatus, filtered by a GFP bandpass filter, and collected by a silicon photomultiplier (SiPMT) (green line). Top: The output of the SiPMT is amplified by a lock-in amplifier and digitized using a DAQ device. Visual stimulation is controlled by the same DAQ device to drive an LED light source. Left: Acquired data from simultaneous calcium-based fiber photometry and fMRI. Both calcium and BOLD time courses are obtained from a region of interest under the optic fiber. T1 weighted fMRI image shows implanted optic fiber with respect to a group functional activation map. Red line denotes visual stimulation of the contralateral eye.
