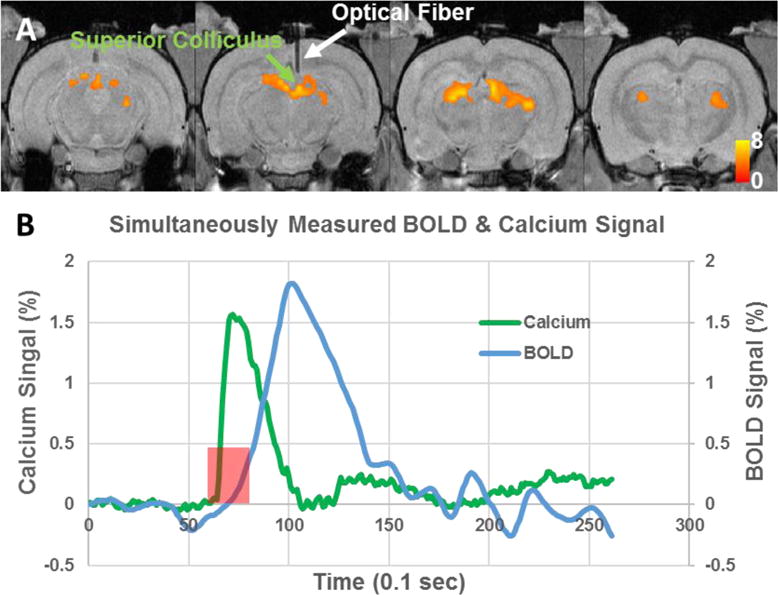
Figure 4.

A, Group functional activation map during visual stimulation (N=7). T values were thresholded at p<0.05 (FDR corrected). White arrow indicates implanted optical fiber. B, Averaged time courses of the BOLD and calcium signals around the tip of the optical fiber (5 rats, 2-sec stimulation).
