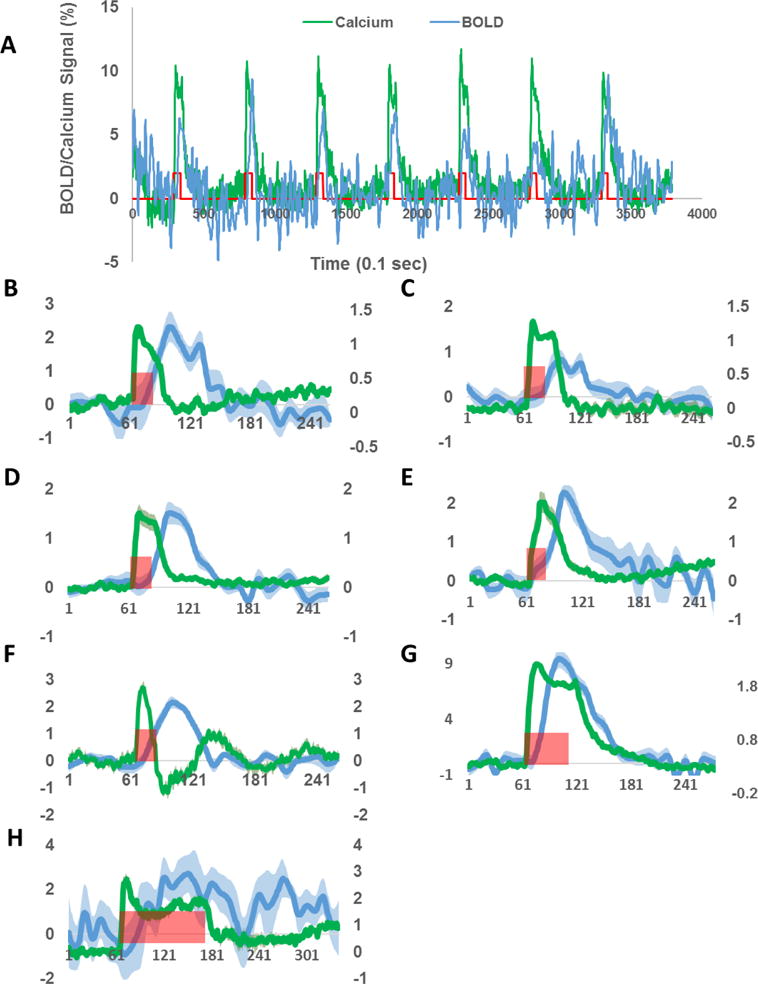
Figure 5.

Simultaneously acquired BOLD and calcium time courses in each individual rat. A, BOLD and calcium responses to single trials of visual stimulation. B–H, Averaged BOLD and calcium time courses for Rat 1 to 7, respectively. Green traces: calcium signals. Blue traces: BOLD signals. Shaded regions denote standard error of the mean. Red bars indicate visual stimulation periods. X axis: time in 0.1s. Left y axis: % change of BOLD signal. Right y axis: % change of calcium signal.
