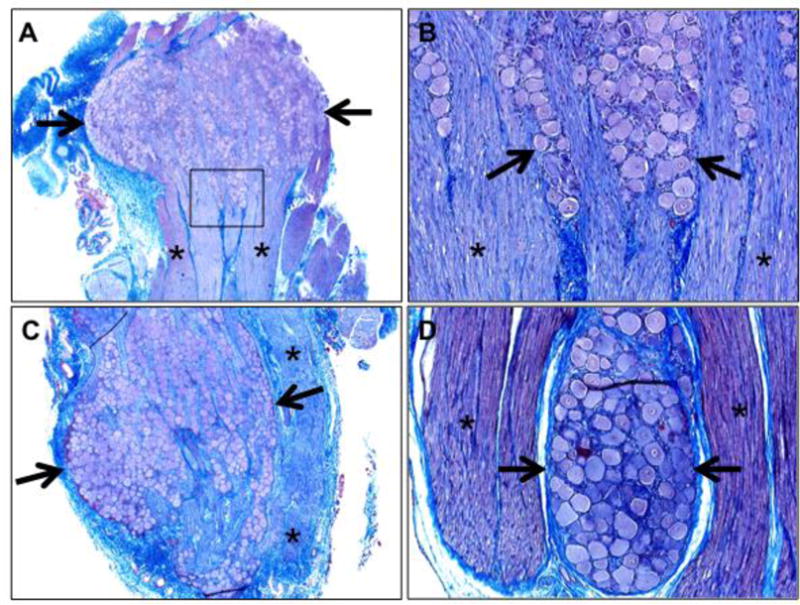
Figure 4.

Histological confirmation of ganglia collection. A) Trigeminal ganglia, 20×. B) Trigeminal ganglia (box in figure 4A), 100×. C) Nodose ganglia, 40×. D) Dorsal root ganglia, 100×. Note the ganglia that are observed by aggregates of neurons (A-D, arrows) and are adjacent to nerves (A-D, highlighted by asterisks), Masson’s trichrome stains.
