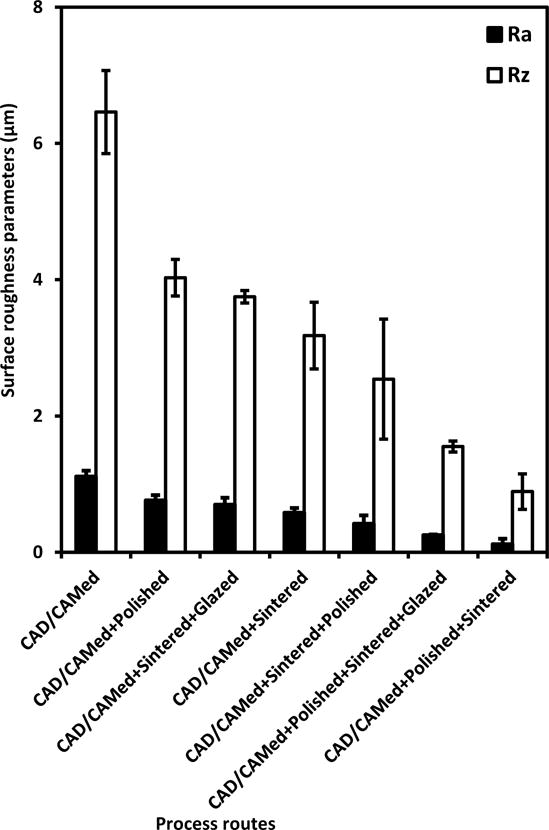
Fig. 7.

Arithmetic mean roughness, Ra, and maximum roughness, Rz, versus different process routes. Each data point is the mean value of three profiles on each processed surface; the error bars correspond to ± one standard deviation for the three profiles.
