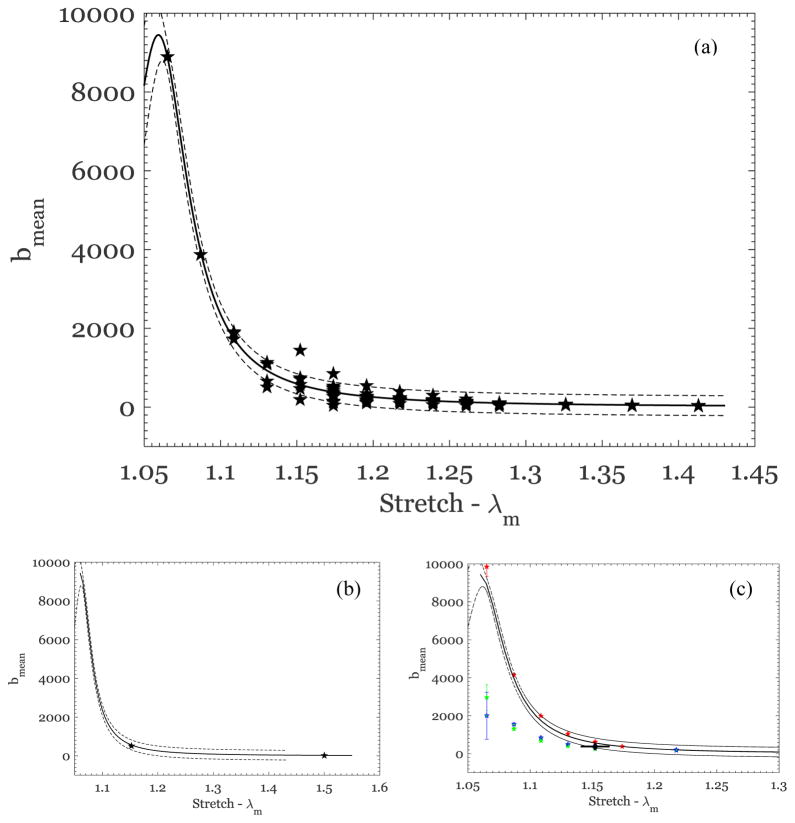
Figure 7.
(a) Dependence of the Hart-Smith model parameter b on the previous maximum stretch; the symbols represent the best estimates for b from each test for patients P3, P5 and P6. The solid line is the best fit Eq.(2), and the dashed lines show the 95% confidence interval. (b) The best-fit parameter b for P1, where all specimens were tested after freezing and storage for 106 to 288 days. (c) The best-fit parameter b for P4 in different irradiated specimens, subjected to protocols indicated in Table 1; while one specimen (red pentagrams) follows the trend of the unirradiated specimens, the other two trials (blue and green pentagrams) fall outside the 95% confidence interval. One set of results from specimen P2 (with a scar) is also shown by the diamond symbols (at a stretch of ~1.15, identified by the horizontal line attached to the symbol).

