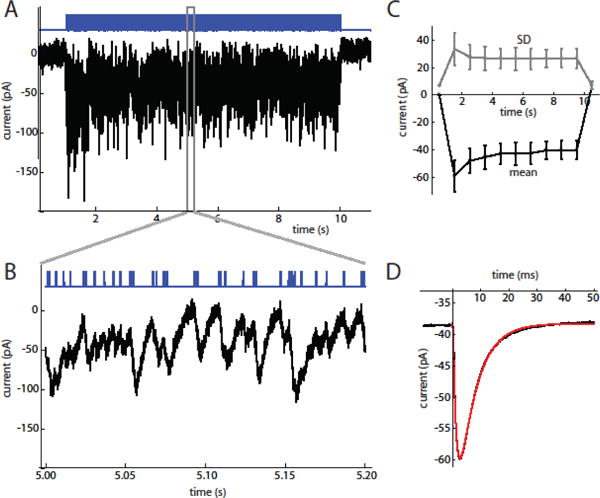
Figure 1. ChR2 current responses to optogenetic barrage stimulation.

A. 9 s stimulus barrage (top, blue trace) and current response (bottom trace) in an SNr neuron (V = −80 mV). The baseline holding current was subtracted from the trace.
B. Expanded view of stimulus barrage and steady-state response, showing the summated fluctuations produced by individual stimulus pulses. C. Mean (bottom, black line) and SD (top, gray line) of stimulus current measured in 1 s bins (n = 6 cells). D. Average current response to a stimulus pulse in the example cell during the steady-state period. The average response rises from a non-zero baseline resulting from the decay of responses to previous stimulus pulses. The fitted function (red line) is the convolution of a double exponential, I0 + A exp(−t/τrise) − A exp(−t/τdecay), with the square-pulse waveform of an individual stimulus pulse. For this cell, τrise = 1.23 ms and τdecay = 6.13 ms.
