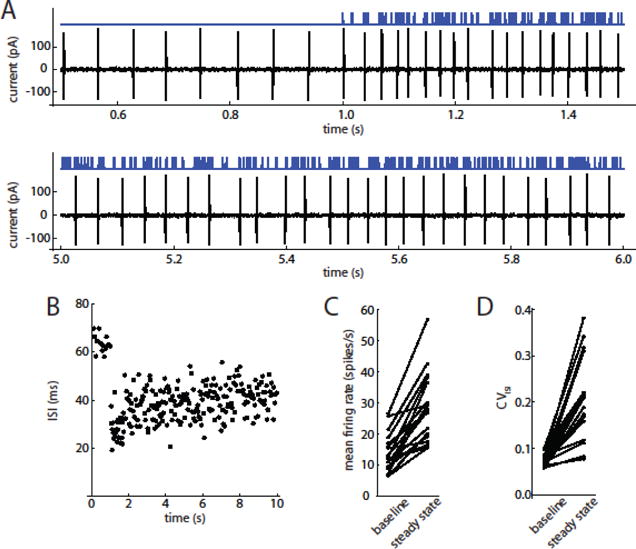
Figure 2. Spike responses to optogenetic barrage stimulation.

A. Optogenetic pulse barrage (top, blue trace) and corresponding spike response of an SNr neuron recorded in the on-cell voltage-clamp mode (bottom, black trace). Top panel shows the autonomous firing before stimulus onset (up to 1 s) and the initial response. Bottom panel includes a portion of the steady-state response, showing the sustained increase in firing rate and variability of ISIs. B. ISIs of this cell during this barrage. C. Effect of optogenetic barrages on mean firing rate (steady-state) (n = 18 cells). D. Effect of optogenetic barrages on CVISI.
