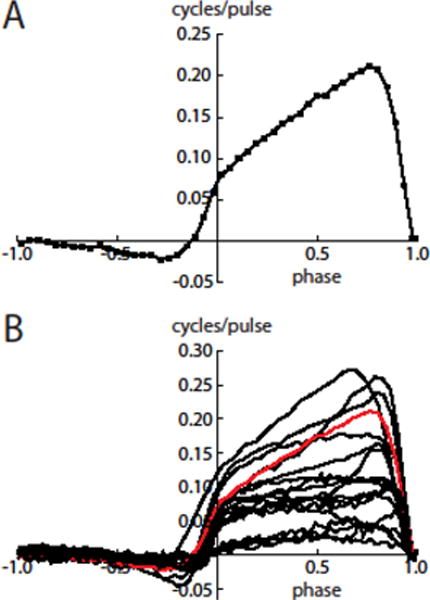
Figure 3. Primary and secondary PRCs measured by optogenetic barrage stimulation.

A. PRC of an example SNr neuron. The primary PRC is the portion to the right of the vertical axis (phases of 0–1), and the secondary PRC is the portion to the left of the axis. Typical features seen in this cell are the upward slope and lack of a negative region in the primary PRC and the relatively small negativity in the secondary PRC. Error bars are smaller than the size of the symbols. B. Primary and secondary PRCs of 18 SNr neurons. The PRC from panel A is shown in red.
