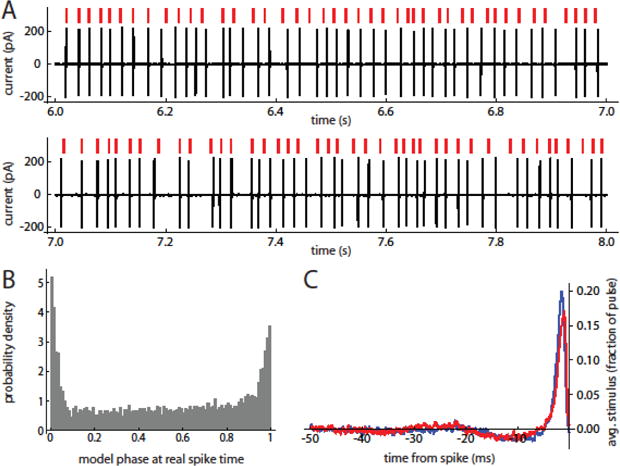
Figure 5. Prediction of the spike-triggered average stimulus by phase models with experimental PRCs.

A. Free-running model prediction of spike response to stimulus barrage. Red marks indicate model spike times. Black trace is spike response of SNr neuron with the PRC used to generate the model. B. Probability density of model phase at real spike times. Note the large peak around phases of 0/1, showing substantial correspondence between model and cell oscillations. C. Spike-triggered average stimuli for the example cell (blue trace) and the corresponding model (red trace).
