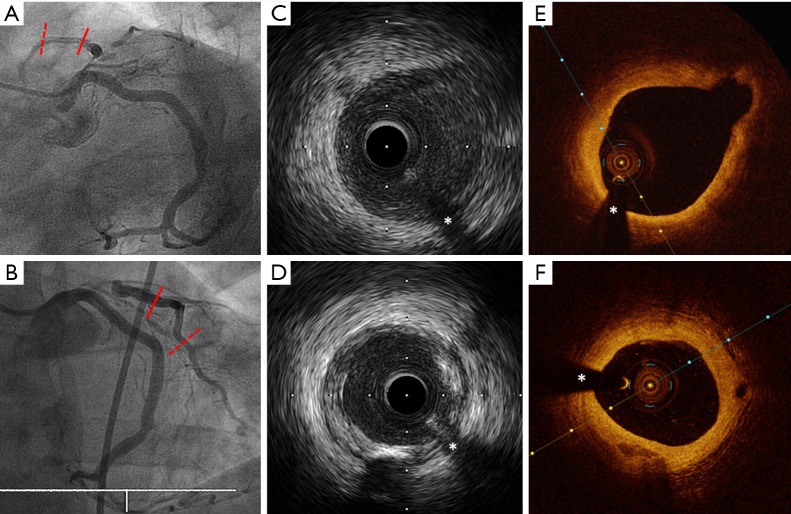
Figure 1.
Angiographic images (A,B): a thin longitudinal radiolucent line along the LAD with extension to first diagonal branch can be seen after a severe stenosis in the proximal LAD suggesting a spontaneous coronary artery dissection (SCAD). This entity was discarded by both IVUS and OCT (C-F). Panels C and E (corresponding to the continuous red lines in the angiography pictures) show IVUS (C) and OCT (E) images of the LAD 10 mm distal to the severe LAD stenosis. Panels D and F (corresponding to the discontinuous red lines in the angiography pictures) show IVUS (D) and OCT (F) images of the mid-distal LAD. LAD, left anterior descending artery; IVUS, intravascular ultrasound; OCT, optical coherence tomography.

