Figure 2.
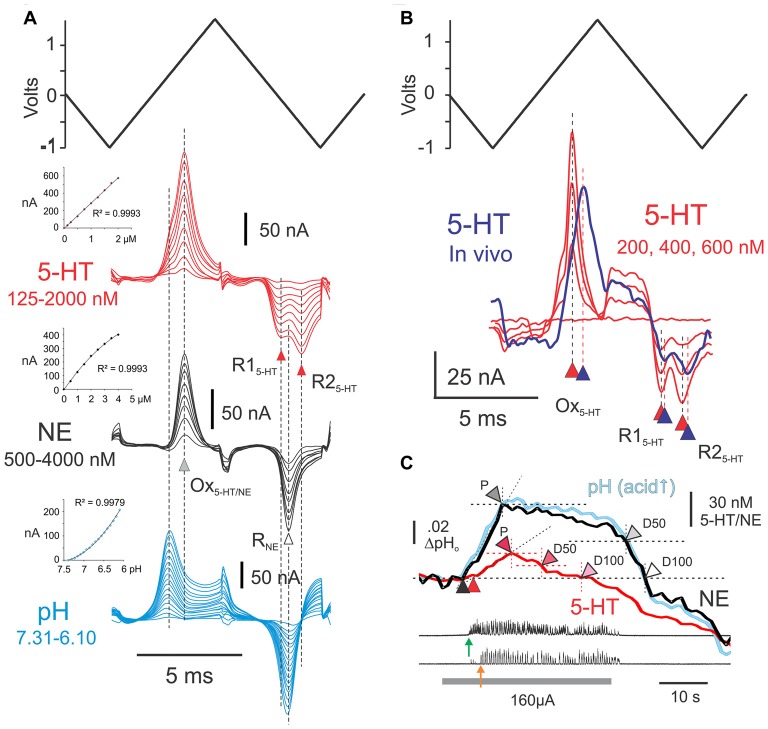
Experimental procedures for detection and estimation of transmitter levels. (A) Post-experimental ex vivo calibration of CFMEs. Results of ex vivo calibrations in different concentrations of 5-HT and norepinephrine (NE) in phosphate buffered saline, pH 7.4 (5-HT: 125, 250, 500, 750, 1000, 1250, 1500, 1750 and 2000 nM; NE: 0.5, 1.0, 1.5, 2.0, 2.5, 3.0, 3.5 and 4.0 μM). Subtracted voltammograms are averages of 40 scans. Also shown is the triangular input waveform (top). Peak oxidation currents for 5-HT and NE (Ox5-HT/NE) occur at approximately the same voltage ex vivo (gray arrowhead). Double (R15-HT and R25-HT) and single (RNE) reduction peaks are observed for 5-HT and NE (black and white arrowheads, respectively). The single noradrenergic reduction peak occurs approximately mid-way between the double serotonergic reduction peaks. Subtracted voltammograms illustrating pH effects over the range 7.31–6.1, generated by the addition of concentrated hydrochloric acid (17 steps), are shown beneath the monoamine calibrations. Insets: calibration curves for 5-HT, NE and pH. (B) Subtracted voltammogram (purple line) obtained from the L6 spinal segment (lamina VII) following microinjection of 100 μM 5-HT near the microelectrode. The voltammogram is an average of 20 scans obtained at the peak of the 5-HT concentration wave observed after injection. It is overlayed with the voltammograms (red lines: 20 scans each) obtained during ex vivo calibration in concentrations of 5-HT that are within the range of the in vivo signal. Note slight delay in peak oxidation and reduction currents. (C) Measurements made from principle component regression (PCR) derived in vivo signals during MLR evoked locomotor activity. Onset of bursting and locomotor activity are indicated with green and orange arrows, respectively. Black and red arrowheads indicate onset of release of NE and 5-HT relative to baseline (pre-locomotor) levels. Other arrowheads indicate peak levels (P), and 50% (D50) and and 100% (D100) decline-to-baseline. MLR stimulation indicated by gray bar.

