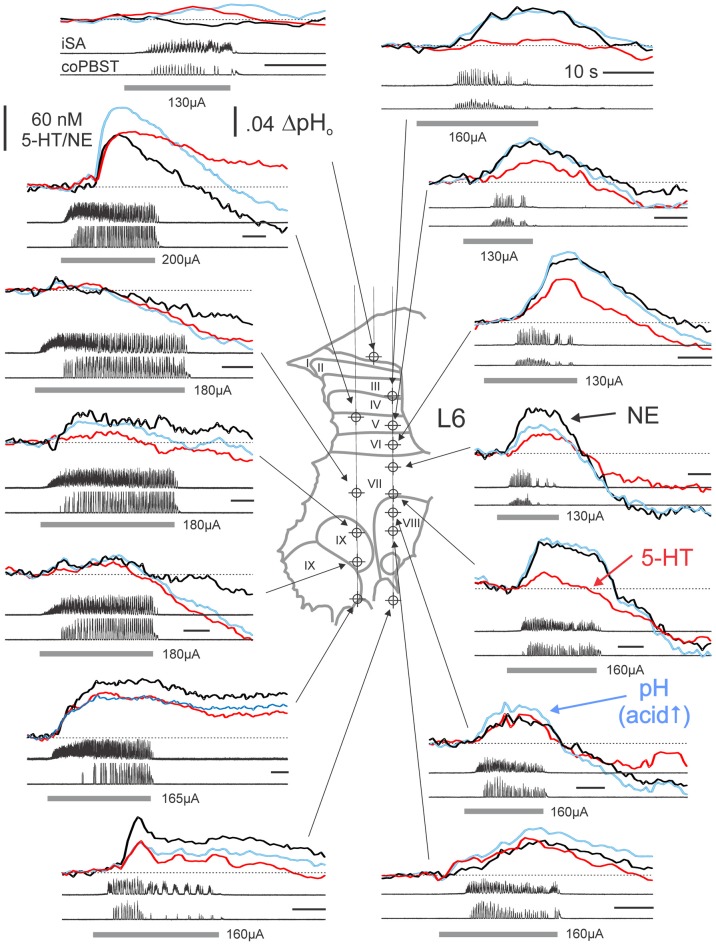
Figure 3.
Monoamine release profiles generated at various locations within the L6 spinal segment from a single experiment. Monoamine release profiles determined from PCR analysis of subtracted voltammograms are plotted with respect to the time of occurrence during separate trials of MLR-evoked fictive locomotion. Monoamine concentrations and pH measures reflect relative changes from baseline, non-locomotor (at rest) levels obtained at each site immediately prior to each trial. NE, 5-HT and pH signals are indicated by thick black, red and blue lines, respectively. Recording sites indicated on histological reconstruction of the electrode tracks observed in spinal sections create a “map” of monoamine release. Locomotor activity is observed in ENG recordings from single ipsilateral and contralateral nerves for each trial of MLR-evoked fictive locomotion. Gray bars indicate the period of MLR stimulation (ipsilateral to FCV recording; 130–200 μA, 15 Hz, 1 ms duration; strength indicated for each trial). Calibration bars: 10 s. SA: sartorius; PBST: posterior biceps/semitendinosus; i: ipsilateral; co: contralateral.

