Figure 7.

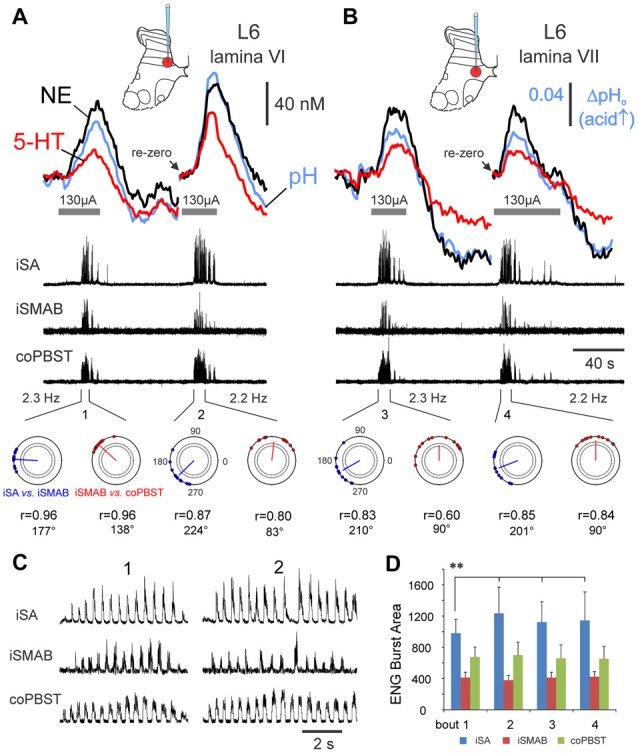
Monoamine release within the spinal cord is modulated in tandem with locomotor activity. Changes in monoamine transmitter and pH levels during repeated trials of MLR-evoked fictive locomotion recorded in medial lamina VI (A) and VII (B) of the L6 lumbar segment. Release is reproducible when locomotor quality is similar in repeated trials at the same location, as gauged by locomotor frequency, ENG burst area and timing profiles (polar plots—bottom row in (A,B)): see similarity in peak concentrations and release profiles for repeated trials in lamina VII (B). In contrast, when locomotor quality differs in repeated trials as in (A), the peak concentrations of both NE and 5-HT show positive correlation to the burst area of the ipsilateral flexor nerve (D), rather than to locomotor frequency, which does not significantly differ throughout trials (values listed at bottom in (A,B)). Locomotion is indicated by the recorded ENG activity in middle traces in (A,B) from various peripheral nerves and in expanded form in (C) for bouts 1 and 2. (D) ENG locomotor burst area (mean and ± SD, in arbitrary units) for each nerve from bouts 1–4 (n = 12, 18, 20 and 18 steps for bouts 1–4, respectively). Note that the averaged locomotor burst area of the iSA in bout 1 was significantly different (**p < 0.01) than for all other bouts. Horizontal lines beneath the oxidation current waveform show the period of MLR stimulation (130 μA, 15 Hz, 1 ms duration). Polar plots (bottom in A,B) showing the circular distribution of phase values of 9–12 random steps (filled circles) from each bout of locomotion (1–4) and the mean phase values indicated by the angle of the vector originating from the center of the circle. The position on the polar plot indicates the latency of onset of activity for iSA vs. the iSMAB ENGs (blue) and for iSMAB vs. contralateral coPBSt ENGs (red). The length of the vector (r) ranged from 0.6 to 0.96 and indicated that all nerves were phase-related since the r values were greater than the critical Rayleigh’s values (dotted circles inside of the polar plot with p values of <0.05 and <0.01). A slight shift in phase value occurred between bouts 1 and 2.
