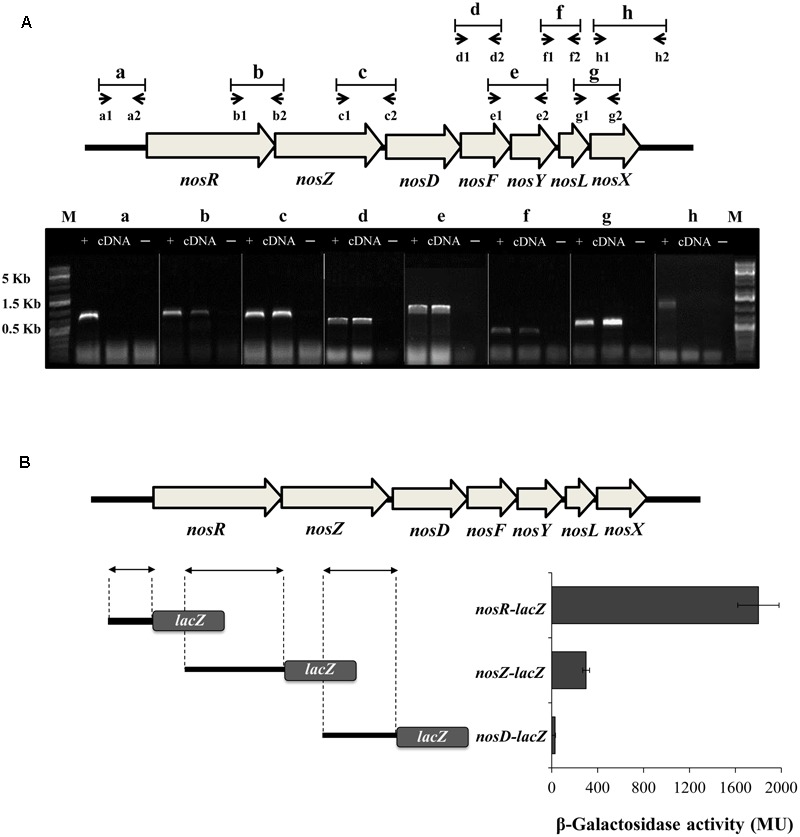
FIGURE 1.

Transcriptional organization of the B. diazoefficiens nosRZDFYLX genes. (A) Putative intergenic regions probed by RT-PCR are labeled as “b-to-g” and the small arrows below depict positions and orientation of the PCR primers used for each intergenic region. Combinations of primers a1/a2 and h1/h2 were used to amplify “a” and “h” flanking regions. Primer sequences are shown in Supplementary Table S1. RT-PCR products of each primers’ pair combination were loaded on an agarose gel. Total RNA served as the template for cDNA synthesis by using gene specific primers that hybridize in the complementary sequence of nosD and nosX genes. PCR amplifications using genomic DNA as template (+) or without reverse transcriptase (–) served as positive and negative controls, respectively. The sizes of the marker (M) bands are labeled on the left side. (B) β-galactosidase activity from the DNA regions upstream of nosR, nosZ, and nosD genes fused to the lacZ reporter gene (on the right). On the left, the DNA regions fused to lacZ are depicted by arrows. In (A,B), B. diazoefficiens wild-type (WT) cells were grown for 24 h under low oxygen conditions (initial 0.5% O2) with 10 mM KNO3. Data expressed as Miller units (MU) represent mean values and error bars from triplicate samples from at least two independent cultures.
