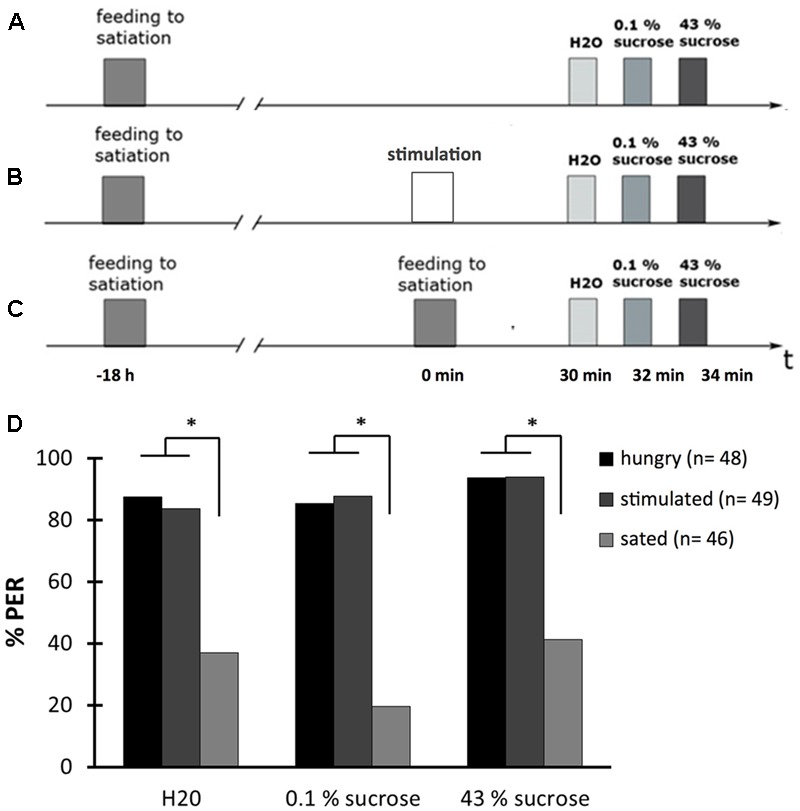
FIGURE 6.

The proboscis extension response (PER) depends on the feeding state. (A) Schematic overview of the experiment. Bees were fed to satiation with 30% (w/v) sucrose solution (0.88 M) 18.5 h before testing the PER (hungry). The PER was tested with water (H2O), with 0.1% (w/v) sucrose solution (2.9 mM) (0.1% sucrose), and with 43% (w/v) sucrose solution (1.25 M) (43% sucrose). (B) Schematic overview of the experiment. Bees were fed to satiation with 30% (w/v) sucrose solution (0.88 M) 18.5 h before testing the PER and were stimulated at their antennae with 30% (w/v) sucrose solution (0.88 M) 30 min before testing the PER (stimulated). The PER was tested as described in (A). (C) Schematic overview of the experiment. Bees were fed to satiation with 30% (w/v) sucrose solution (0.88 M) 18.5 h and again 30 min before testing the PER (sated). The PER was tested as described in (A). (D) The PER depends on the feeding state of bees. The percentage of hungry bees responding with a PER is higher than the percentage of sated bees but the percentage of stimulated bees responding is as high as of hungry bees. ∗p < 0.05. Number of bees appears in brackets.
