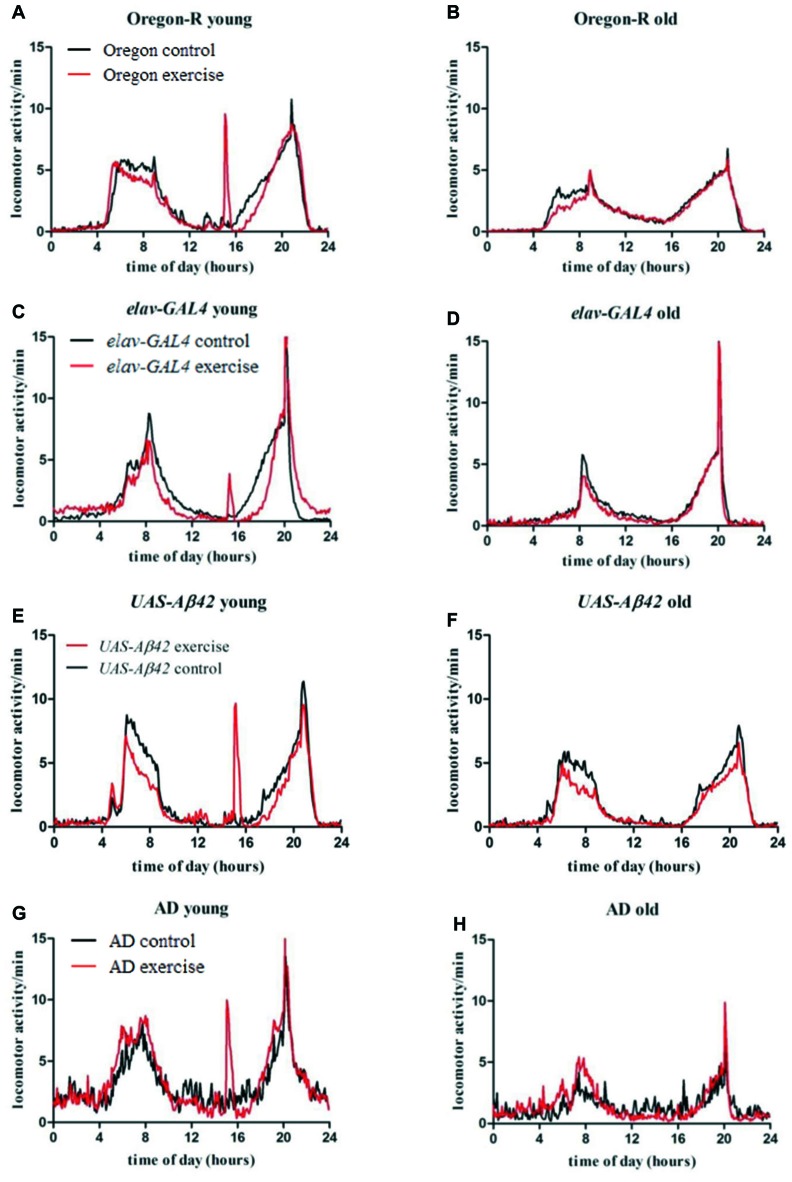
Figure 3.
Average locomotor activity (activity counts per 5 min) of 32 flies per genotype was measured over 20 days for exercising (red line) and stationary animals (black line) in a 12:12 h light dark cycle (LD12:12; lights on 8 am: ZT0). Data are plotted over time of the day to visualize average activity in the morning (4 am–12 am), evening (4 pm–10 pm) as well as during activity induction (3 pm–3.30 pm) and siesta sleep (12 am–4 pm), respectively. Left figures (A,C,E,G) show activity of young flies during activity induction (day 1–12), right figures (B,D,F,H) display activity of old flies in the post-training phase (day 13–20).

