Figure 6.
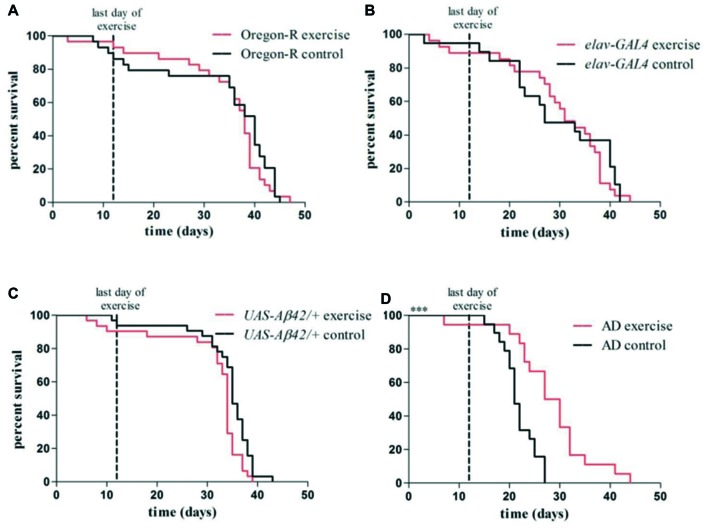
Kaplan–Meier plots show survival rates of exercising flies compared to non-exercising control groups (A–D). Red lines represent survival curves of exercising groups, black lines show survival curves of non-exercising control groups. Vertical line at day 12 marks the last day of the exercise phase. (A–C) Exercising in the swing boat device did not significantly affect survival of Oregon-R (40.0 days), elav-GAL4 (31.0 days) and UAS-Aβ42/+ (34.0 days) control flies compared to non-exercising controls (Oregon-R: 38.0 days, elav-GAL4: 27.0 days, UAS-Aβ42/+: 35.0 days). (D) Median survival time of exercising AD flies (28.5 days) was significantly longer (***p < 0.001) compared to non-exercising AD flies (21.5 days).

