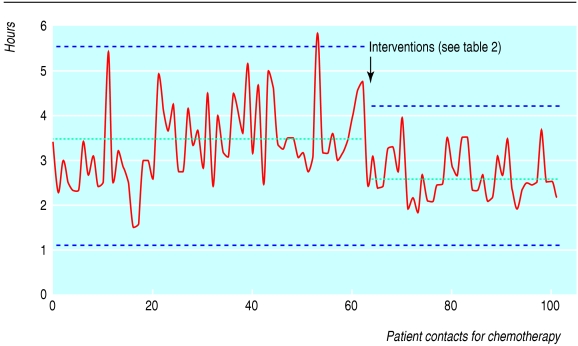
Fig 3.
Time from registration at the outpatient clinic to start of chemotherapy. Time measurements were plotted as a run chart. Control limits (dotted blue lines) were calculated as: upper/lower control limit=mean waiting time±(2.66×average point to point variation—that is, moving range). Dotted green lines represent average waiting times

