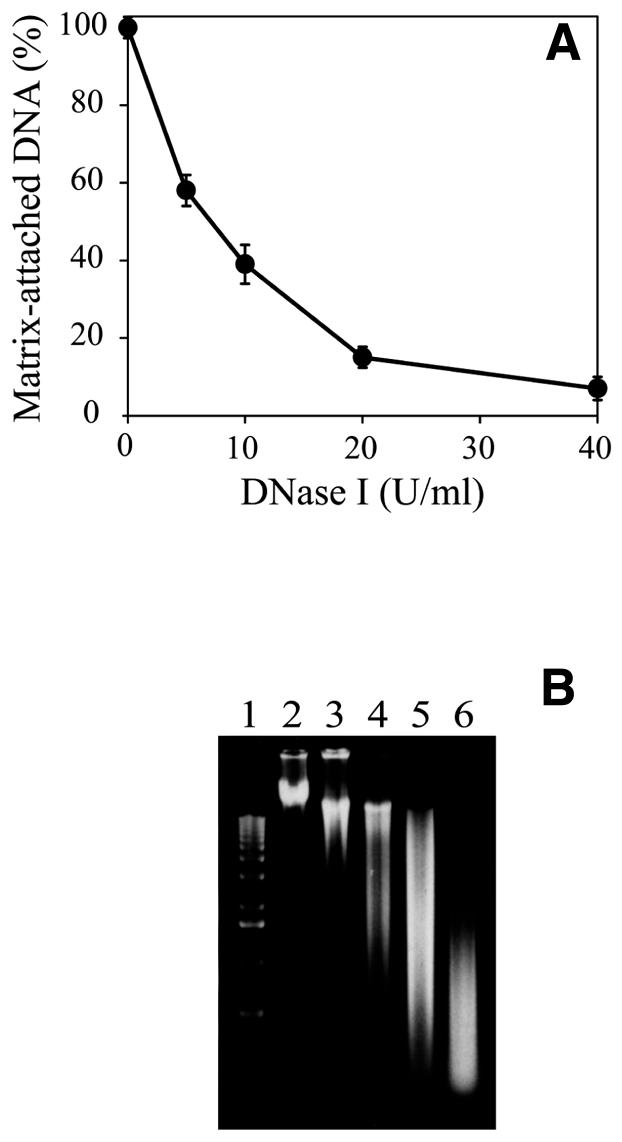
Figure 1.

Kinetics of digestion with DNase I. (A) Percentage of matrix-attached DNA as a function of DNase I concentration. Each point is the mean of three independent experiments. Error bars show standard deviations. (B) Agarose gel electrophoresis of DNA isolated from nuclear matrix prepared with different concentrations of DNase I. Lane 1, 1 kb DNA ladder; lane 2, control DNA from permeabilized cells undigested with DNase I; lanes 3–6, DNA from cells treated with 5, 10, 20 and 40 U/ml DNase I.
