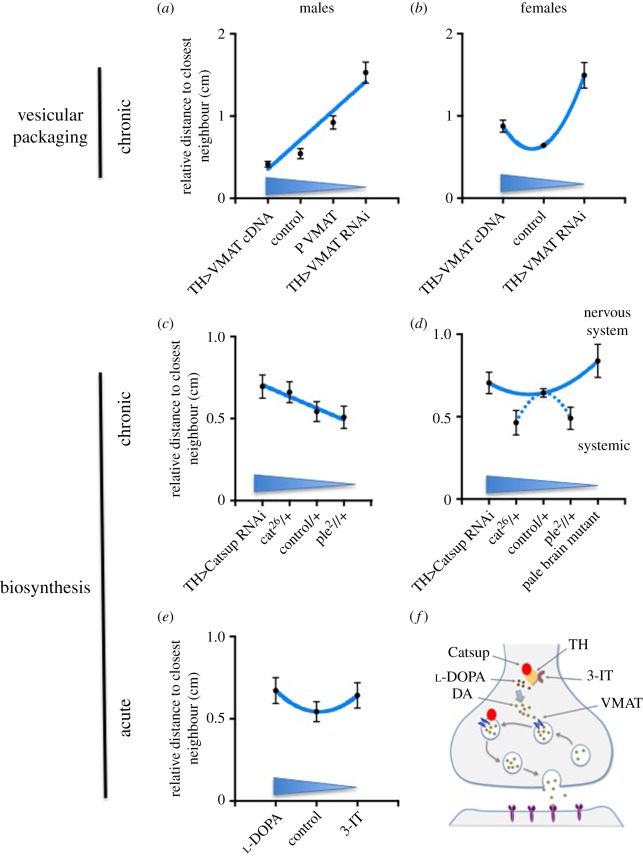
Figure 2.
Linear (a,c) and curvilinear (U-shaped, b,d,e) distribution of social spacing in response to presynaptic modification in dopamine levels, depending on type of alteration (chronic or acute, systemic or nervous system, biosynthesis or vesicular packaging), and sex. The genotypes or treatments are ordered in expected decrease in dopamine (from high to low—blue arrows). Data are represented as relative means (± s.e.m.) of the social space distributions. (f) Diagram of a synapse, indicating the proteins altered by the pharmacological and genetic manipulations in this study. DA, dopamine.

