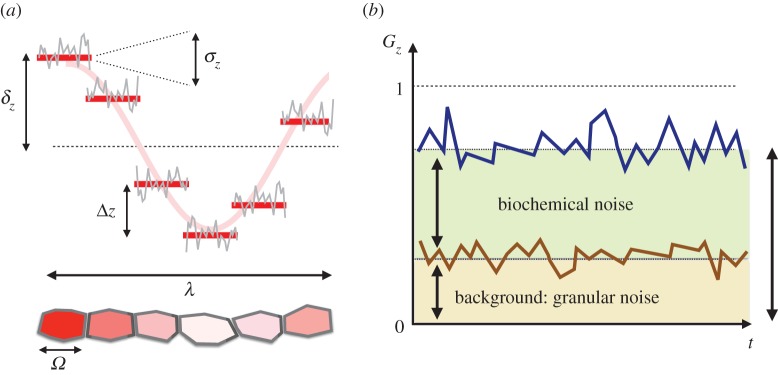
Figure 1.
(a) In a patterning situation, the finite cell size, Ω, sets a characteristic protein concentration variability for species Z between neighbouring cells, Δz, that accounts for the analogue-to-digital conversion of the continuous concentration levels: the so-called granular noise. The biochemical fluctuations at the single-cell level (grey line) additionally contribute to the concentration variability by an amount σz. Finally, patterning itself implies protein differences of order δz (pattern amplitude) at length scales of the order of the pattern wavelength, λ. (b) In a periodic pattern, the nearest-neighbours autocorrelation function, Gz, characterizes the variability at the single-cell level (blue line) by filtering out global patterning effects and allows us to differentiate between the background level due to granularity (brown line/shaded area) and the effective contribution of biochemical fluctuations (green shaded area).

