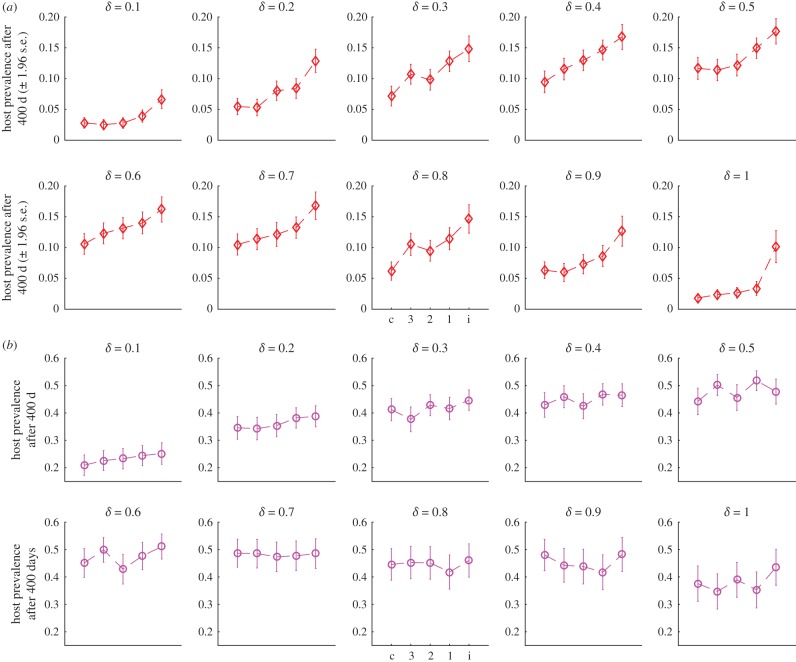
Figure 3.
(a) Mean prevalence ±1.96 s.e. of infection in hosts 400 days following introduction of a single infected case at different levels of human commuting (δ). Dashed lines merely provide a visual cue. Control is implemented as a collective response targeting all patches in the environment (c); at the individual patch level and all neighbours three steps or less removed (3); the patch and all neighbours two steps or less removed (2); the patch and its nearest neighbours (1); or only at the individual patch level (i). Control can occur in up to 80% of patches, with 20% not cooperating. (b) The same, except treatment only occurs in 50% of the patches. (Online version in colour.)

