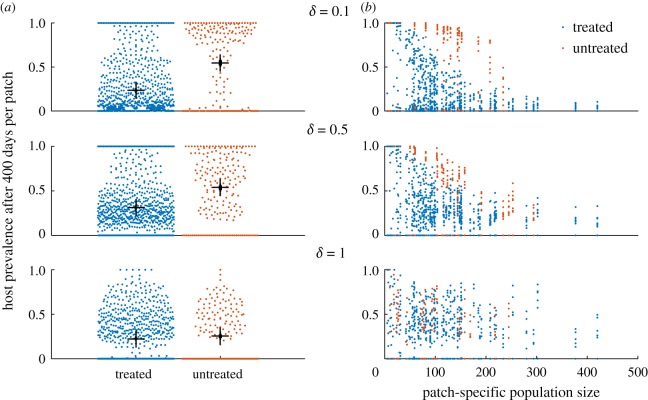
Figure 7.
Prevalence at the patch level in hosts after 400 days (based on 10 replicates). Control was done at the individual patch level, i.e. without coordination. (a) Dots represent the proportion of hosts that are infected in individual patches. The mean prevalence of infection and standard error over all patches are indicated by the black bars. (b) The proportion of hosts that are infected in individual patches of varying host population sizes.

