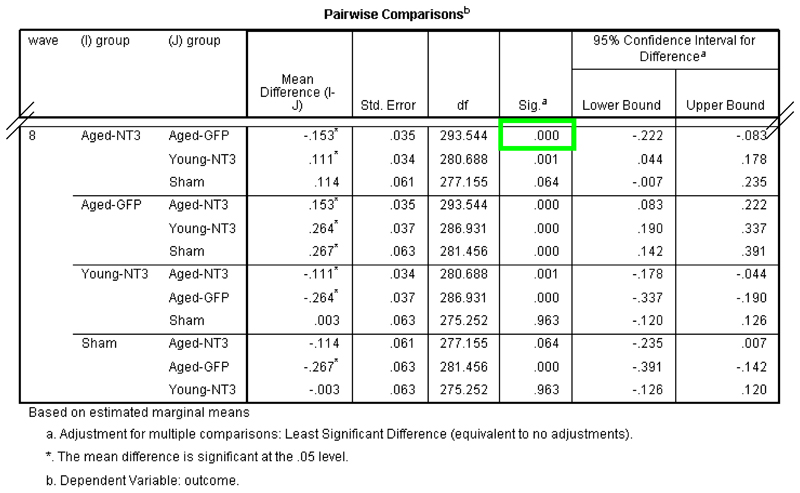
Figure 8.
Screenshot of SPSS Output. Results of pairwise comparison of significant interaction of wave by group. Top panel shows table header and bottom panel shows results for wave eight (bottom of table, after intervening part of table removed for clarity). There was a significant difference between aged stroke rats treated with AAV-NT3 and those treated with AAV-GFP at week eight (green box).

